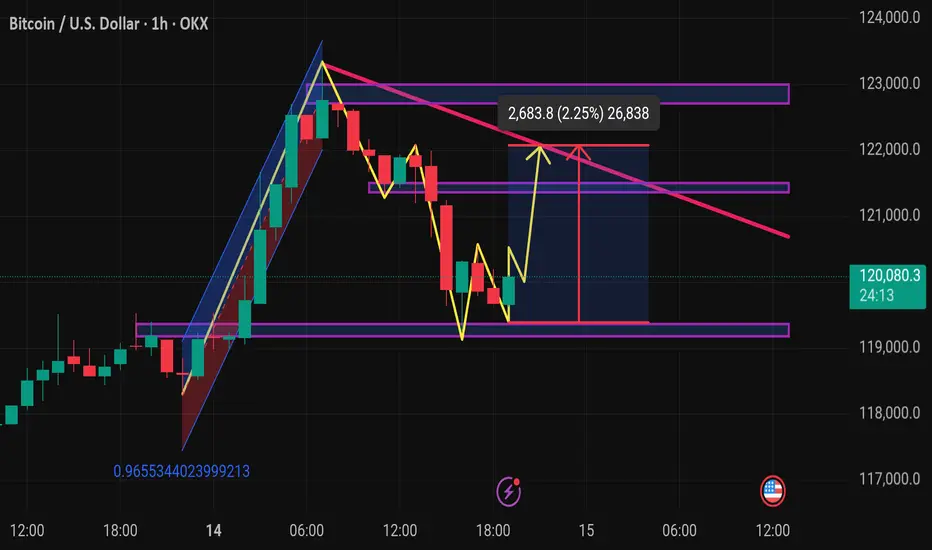
This chart is a 1-hour candlestick chart for Bitcoin/US Dollar (BTC/USD) from OKX, analyzed using TradingView. Here's a breakdown of the technical elements:
---
🔍 Key Observations:
1. Current Price
$120,054.6 with a +0.77% gain.
Price appears to be rebounding from recent support.
2. Chart Patterns & Annotations
Yellow Zigzag Lines: Indicate recent price action and a potential bullish reversal pattern forming.
Purple Zones: Likely represent key support and resistance levels.
Pink Downtrend Line: A descending trendline showing the bearish resistance.
Blue Box Area: Suggests a potential price movement range—either up or down.
---
📈 Technical Analysis Insights
✅ Bullish Case (Upside Scenario)
Break above descending trendline could lead BTC to:
Target: ~122,800 - 123,000
Potential
---
🔍 Key Observations:
1. Current Price
$120,054.6 with a +0.77% gain.
Price appears to be rebounding from recent support.
2. Chart Patterns & Annotations
Yellow Zigzag Lines: Indicate recent price action and a potential bullish reversal pattern forming.
Purple Zones: Likely represent key support and resistance levels.
Pink Downtrend Line: A descending trendline showing the bearish resistance.
Blue Box Area: Suggests a potential price movement range—either up or down.
---
📈 Technical Analysis Insights
✅ Bullish Case (Upside Scenario)
Break above descending trendline could lead BTC to:
Target: ~122,800 - 123,000
Potential
🎯XAUUSD GOLD Daily 8-9 Free Signals🚀 World Best community Join Here ✅
💫XAUUSD
💫BTC
💫EURUSD
For Signals Telegram channel
⬇️⬇️⬇️⬇️⬇️⬇️⬇️⬇️⬇️⬇️⬇️⬇️⬇️
t.me/technicaltrader10
💫XAUUSD
💫BTC
💫EURUSD
For Signals Telegram channel
⬇️⬇️⬇️⬇️⬇️⬇️⬇️⬇️⬇️⬇️⬇️⬇️⬇️
t.me/technicaltrader10
Disclaimer
The information and publications are not meant to be, and do not constitute, financial, investment, trading, or other types of advice or recommendations supplied or endorsed by TradingView. Read more in the Terms of Use.