Bitcoin (BTC/USD) Technical Analysis  – Daily Chart Overview
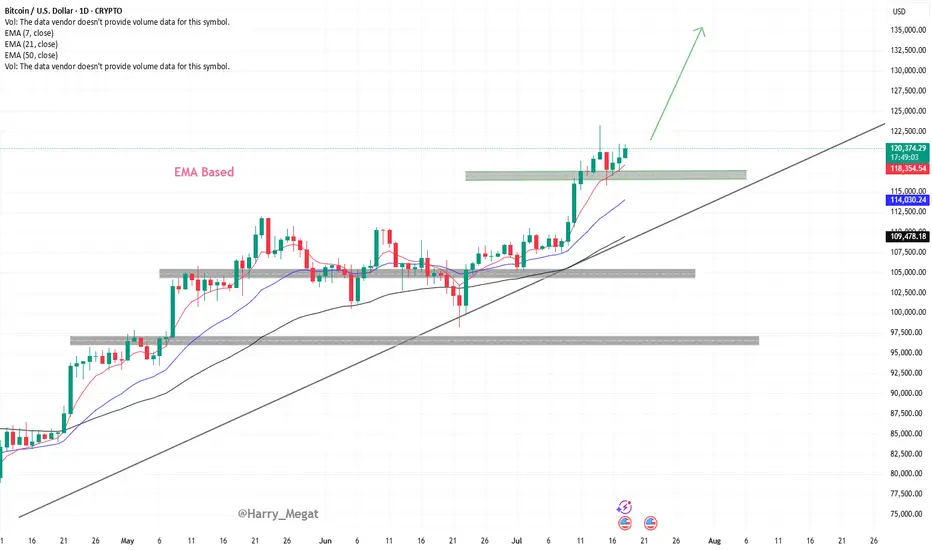
This chart shows a **bullish continuation setup** for Bitcoin, supported by **EMA structure**, **trendline**, and **support zone** validation. Here's the detailed breakdown:
**1. Trend & Structure**
* **Uptrend:** Price is in a clear uptrend, making higher highs and higher lows.
* **Trendline:** The ascending trendline confirms strong upward momentum. It has been respected multiple times, acting as dynamic support.
**2. Key Support Zones**
* **Recent Breakout Zone (\~\$118,000 – \$119,000):**
Bitcoin broke out above this horizontal resistance and is now **retesting it as support**. This is a classic bullish retest pattern.
* The chart suggests that as long as price holds above this zone, **bullish continuation** is expected.
**3. EMA Indicators (Exponential Moving Averages)**
* **7 EMA (Red) – \$118,386**
* **21 EMA (Blue) – \$114,042**
* **50 EMA (Black) – \$109,483**
All EMAs are **sloping upwards** and aligned in bullish order (7 > 21 > 50), confirming strong upside momentum. The price is currently above all EMAs, which supports a continuation of the bullish trend.
**4. Bullish Target**
* The green arrow suggests a projected bullish move with a potential target above **\$130,000–\$132,500**, assuming price holds the support and resumes upward.
**5. Risk Area**
* If BTC closes **below the highlighted support zone (\~\$118,000)**, it could invalidate the bullish structure temporarily and push toward the next support near **\$114,000–\$115,000**.
**Conclusion**
* **Bias:** Bullish
* **Actionable Insight:**
* As long as BTC remains above the \$118K support zone and trendline, **buy dips** or **hold longs**.
* A clean break and close above recent highs (\~\$121K–\$122K) could open the door toward **\$130K+** targets.
Trade active
Bitcoin (BTC/USD) reaching **119,700** confirms continued **bullish momentum**. Here’s the breakdown:* **Trend**: BTC remains in an uptrend, making higher highs and staying above its **Exponential Moving Averages (EMAs)**, which act as dynamic support.
* **Support**: Price is **holding above key support levels**, indicating strong buyer interest and limited selling pressure.
* **Momentum**: The current rally shows strength, suggesting bulls are still in control.
As long as BTC stays above the support and EMAs, the bullish trend is likely to continue. A break below those levels could signal a potential pullback.
Disclaimer
The information and publications are not meant to be, and do not constitute, financial, investment, trading, or other types of advice or recommendations supplied or endorsed by TradingView. Read more in the Terms of Use.
Disclaimer
The information and publications are not meant to be, and do not constitute, financial, investment, trading, or other types of advice or recommendations supplied or endorsed by TradingView. Read more in the Terms of Use.