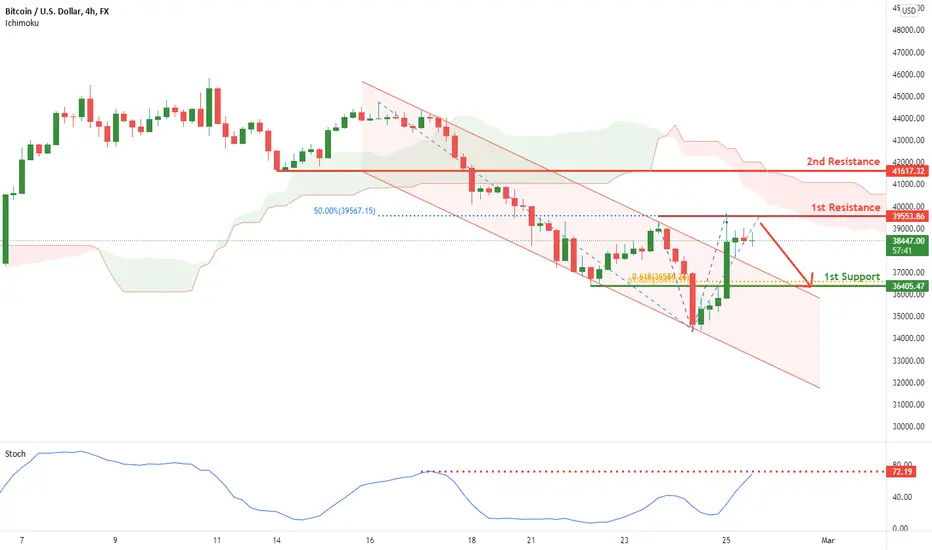
On the H4, we can see that price has broken up of the descending channel. Although this is signifying bullish momentum, we first expect price to drop from 1st resistance at 39553.86 which is in line with our 50.0% fibonacci retracement and horizontal swing high resistance to 1st support at 36405.47 in line with both 61.8% fibonacci projection and retracement, along with horizontal overlap support. Alternatively, price may break through 1st resistance and halt to 2nd resistance at 41617.32 which is in line with the horizontal overlap resistance. Our bias is further supported by how price is moving below the Ichimoko cloud and expected to reverse off the stochastic indicator resistance.
Disclaimer
The information and publications are not meant to be, and do not constitute, financial, investment, trading, or other types of advice or recommendations supplied or endorsed by TradingView. Read more in the Terms of Use.
Disclaimer
The information and publications are not meant to be, and do not constitute, financial, investment, trading, or other types of advice or recommendations supplied or endorsed by TradingView. Read more in the Terms of Use.