I was just looking at this Linear chart and spotted a couple of things.
So many people Use LOGARITHMIC charts.
In summery, A logarithmic chart is a graphical representation that uses a logarithmic scale, which differs from the conventional linear scale. In a logarithmic scale, the distance between values is not constant but increases by a factor, making it useful for datasets with a wide range of values. This approach helps in presenting numerical information more efficiently and allows for a better visualization of rates of change or percentages rather than absolute values.
A LINEAR chart however, shows you the REAL rate of change.
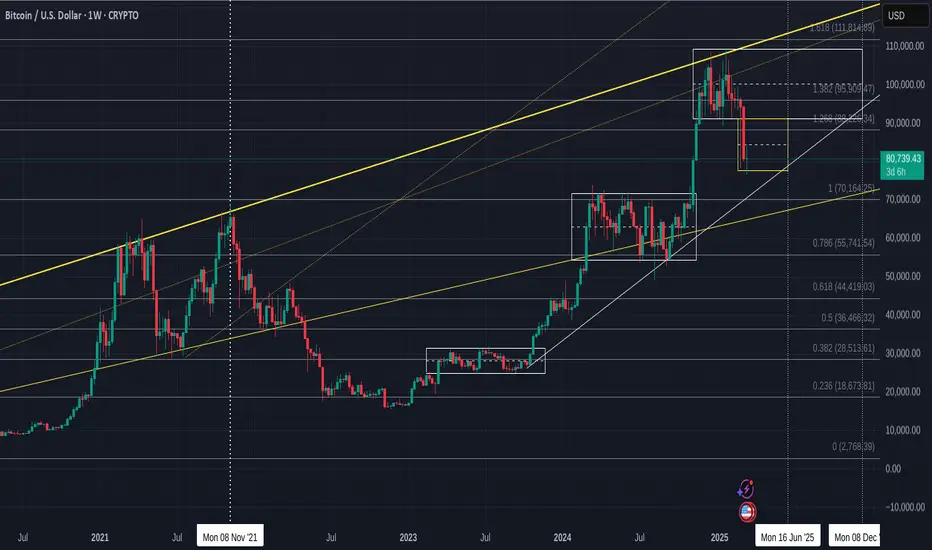
And on This Linear chart, I have noticed that PA is creating a very Similar Top to the MARCH ATH of 2021
I do not think we will follow it perfectly, as that drop in 2021 was over 50% and that would take us down to 52K, which I think is not a real possibility. But, being open to ALL possibilities, that trend line that was used by PA to bounce to the Nov ATH currently sits around 65K But the longer we wait, it heads higher, towards the 1 Fib ext around the Old 2021 ATH near 70K ( 69300)
Also note, how once PA had Dropped in March 2021, it levelled out and slide sideways for around 7 weeks.
So if we come over to Today, we have just dropped around 30% and seem to have found a Floor around 76K
We HAD to drop out of that Upper range box - It would have been December before we found support on the rising Trend line that has been the trigger for moves higher since 2023
And so, we have dropped to a Lower Range Box ( hopefully ) and this box hits the Rising trend line around June.
This has confluence with a number of other charts
And if we do range sideways, around this level, it is similar to that Range after the drop in 2021.
In 2021, after that range, PA rose by around 122%
I am not to sure we would see that but................
So now we wait to see if we stay in this range or not, with a top around 90K
We could See wicks out of this Range, down to the 70K mark maybe, with swift recovery.....
We may also see further Drop....
there is abcolutly NO guarentee that we will even head higher again.....
We have to wait and see and have plans and stick to them..for both BULl and BEAR
So many people Use LOGARITHMIC charts.
In summery, A logarithmic chart is a graphical representation that uses a logarithmic scale, which differs from the conventional linear scale. In a logarithmic scale, the distance between values is not constant but increases by a factor, making it useful for datasets with a wide range of values. This approach helps in presenting numerical information more efficiently and allows for a better visualization of rates of change or percentages rather than absolute values.
A LINEAR chart however, shows you the REAL rate of change.
And on This Linear chart, I have noticed that PA is creating a very Similar Top to the MARCH ATH of 2021
I do not think we will follow it perfectly, as that drop in 2021 was over 50% and that would take us down to 52K, which I think is not a real possibility. But, being open to ALL possibilities, that trend line that was used by PA to bounce to the Nov ATH currently sits around 65K But the longer we wait, it heads higher, towards the 1 Fib ext around the Old 2021 ATH near 70K ( 69300)
Also note, how once PA had Dropped in March 2021, it levelled out and slide sideways for around 7 weeks.
So if we come over to Today, we have just dropped around 30% and seem to have found a Floor around 76K
We HAD to drop out of that Upper range box - It would have been December before we found support on the rising Trend line that has been the trigger for moves higher since 2023
And so, we have dropped to a Lower Range Box ( hopefully ) and this box hits the Rising trend line around June.
This has confluence with a number of other charts
And if we do range sideways, around this level, it is similar to that Range after the drop in 2021.
In 2021, after that range, PA rose by around 122%
I am not to sure we would see that but................
So now we wait to see if we stay in this range or not, with a top around 90K
We could See wicks out of this Range, down to the 70K mark maybe, with swift recovery.....
We may also see further Drop....
there is abcolutly NO guarentee that we will even head higher again.....
We have to wait and see and have plans and stick to them..for both BULl and BEAR
Disclaimer
The information and publications are not meant to be, and do not constitute, financial, investment, trading, or other types of advice or recommendations supplied or endorsed by TradingView. Read more in the Terms of Use.
Disclaimer
The information and publications are not meant to be, and do not constitute, financial, investment, trading, or other types of advice or recommendations supplied or endorsed by TradingView. Read more in the Terms of Use.