Is Bitcoin completing a massive 3-drive structure on the macro chart?
Three clear pushes higher, each with fading momentum, are flashing a major reversal signal.
This could be the final phase before a long-term shift — are you ready for what’s next?

📚 3-Drive Structure Trading Strategy — Full Breakdown
The 3-Drive Pattern is a powerful reversal-based price structure used to spot major turning points in trending markets. It works by identifying three consecutive drives (or pushes) in one direction, typically ending with exhaustion and a high-probability reversal.
🔍 What is the 3-Drive Pattern?

📉 Bearish 3-Drive (Reversal from Uptrend):
🎯Entry Criteria:
🎯 Targets:
🧠 Pro Tips:
💡 Summary:
The 3-Drive pattern is one of the most reliable reversal structures when combined with divergence and Fibonacci symmetry. It's especially powerful at market exhaustion zones and works best with confirmation-based entries.
Three clear pushes higher, each with fading momentum, are flashing a major reversal signal.
This could be the final phase before a long-term shift — are you ready for what’s next?
📚 3-Drive Structure Trading Strategy — Full Breakdown
The 3-Drive Pattern is a powerful reversal-based price structure used to spot major turning points in trending markets. It works by identifying three consecutive drives (or pushes) in one direction, typically ending with exhaustion and a high-probability reversal.
Each drive forms a new high or low, but with weakening momentum — especially visible using RSI, MACD, or volume divergence.
🔍 What is the 3-Drive Pattern?
- 3 consecutive higher highs (or lower lows)
- Each drive followed by a shallow pullback
- Momentum weakens on each push (divergence forms)
- Fibonacci symmetry often present:
- Drive extensions: 127.2%–161.8%
- Pullbacks: usually 61.8%
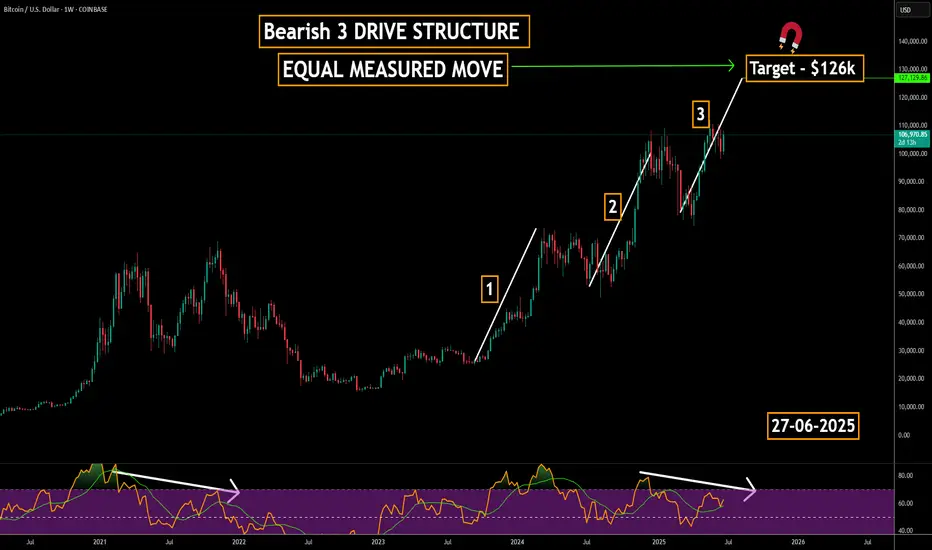
📉 Bearish 3-Drive (Reversal from Uptrend):
- Drive 1: Price makes a higher high with strong momentum
- Drive 2: Another higher high, weaker strength
- Drive 3: Final high with clear divergence
- Reversal: Entry when price breaks below structure
🎯Entry Criteria:
- Wait for all 3 drives to form
- Confirm with divergence on Drive 3
- Use a confirmation candle or structure break
- Stop-loss: just beyond the 3rd drive’s high
🎯 Targets:
- Conservative: Return to Drive 2 base
- Aggressive: Full trend reversal (50%–100% Fib retracement)
🧠 Pro Tips:
- Best on 4H, 1D, 3D or 1w timeframes
- Confirm with RSI, MACD, or volume divergence
- Combine with key S/R or supply-demand zones
💡 Summary:
The 3-Drive pattern is one of the most reliable reversal structures when combined with divergence and Fibonacci symmetry. It's especially powerful at market exhaustion zones and works best with confirmation-based entries.
Trade active
This Chart identifies ascending channels, a classic bullish price structure where price moves between two parallel upward-sloping trendlines. The lower trendline acts as support, while the upper trendline acts as resistance. Traders often use ascending channels to spot trend continuations or potential breakout opportunities, especially when volume and momentum align with the trend direction.
In addition, the Chart highlights equal measured moves (EMMs) — a powerful price action concept where the distance of a previous impulse leg is projected from a pullback or consolidation zone. Equal measured moves often suggest symmetry in market behavior, helping traders forecast potential price targets based on previous swings. This method is commonly used in harmonic structures, breakout strategies, and ABCD patterns.
✅ This chart shows:
Channel support/resistance in an uptrend
Confirm trend strength within the channel
Identify price targets using measured move projections
Spot breakout or breakdown opportunities at the channel edge
🔔 Combine with volume, EMA , or RSI divergence for higher-probability trade setups especially here now as price is at the top of the channel.
Trade closed: target reached
MICRO 3 DRIVE STRUCTURE
WITH ORDER FLOW RESISTANCE
Lots of sell into 3 drive structure target .
Sell wall at $110k - $111k
This is near term action , dips are buys for a lot higher prices
🚀FREE CRYPTO SIGNALS - 5 DAY VIP TRIAL: :trophy:
Discord - No 1 Trading & Education Room:
discord.gg/RWGhAze
Website: Signup
thecryptocheck.com
Free Customisable Data Alerts Platform:
softquant.io
Discord - No 1 Trading & Education Room:
discord.gg/RWGhAze
Website: Signup
thecryptocheck.com
Free Customisable Data Alerts Platform:
softquant.io
Related publications
Disclaimer
The information and publications are not meant to be, and do not constitute, financial, investment, trading, or other types of advice or recommendations supplied or endorsed by TradingView. Read more in the Terms of Use.