This is not a recommendation to buy or sell. This is for entertainment purposes only
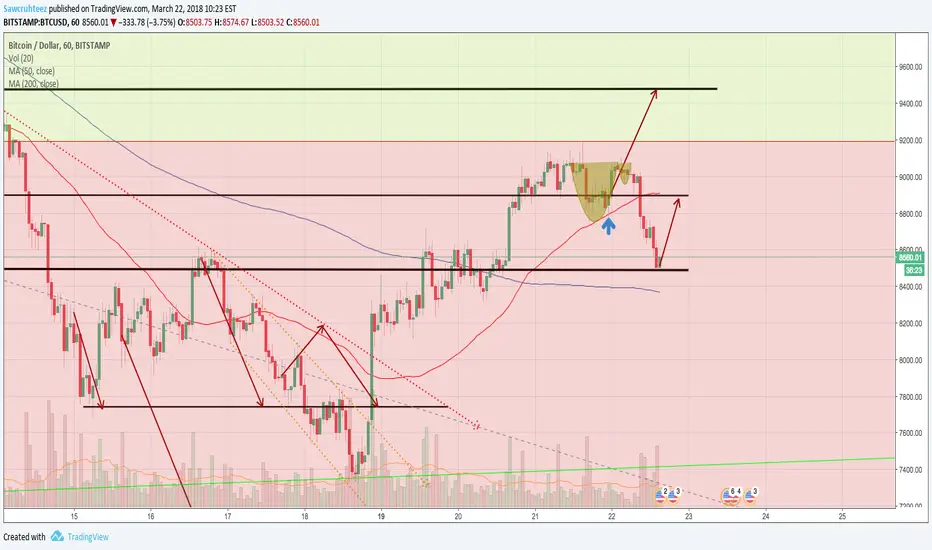
Yesterday I expected us to break up $9,200 resistance. I drew an arrow up to $9,481 after seeing support hold at $8,800 and a bounce from the 50 day SMA.
The daily chart had a reversal doji combined with resistance from the 200 day SMA. If I paid more attention to that then I would have been more cautious with my bullish predictions.
We are currently testing support at $8,500. We should bounce from here up to $8,800 where horizontal resistance will be combined with the 50 day SMA.
I am still waiting on the sidelines for further confirmation.
Following is free!
Note
That is an ugly wick on the current candle. If it closes below $8,600 then it is not looking good at all for the bulls.emasar Indicator is available for purchase at alphanalysis.io/product/emasar/
Disclaimer
The information and publications are not meant to be, and do not constitute, financial, investment, trading, or other types of advice or recommendations supplied or endorsed by TradingView. Read more in the Terms of Use.
emasar Indicator is available for purchase at alphanalysis.io/product/emasar/
Disclaimer
The information and publications are not meant to be, and do not constitute, financial, investment, trading, or other types of advice or recommendations supplied or endorsed by TradingView. Read more in the Terms of Use.