I've made some bearish setups for BTC, but it looks like its time to made bullish analysis.
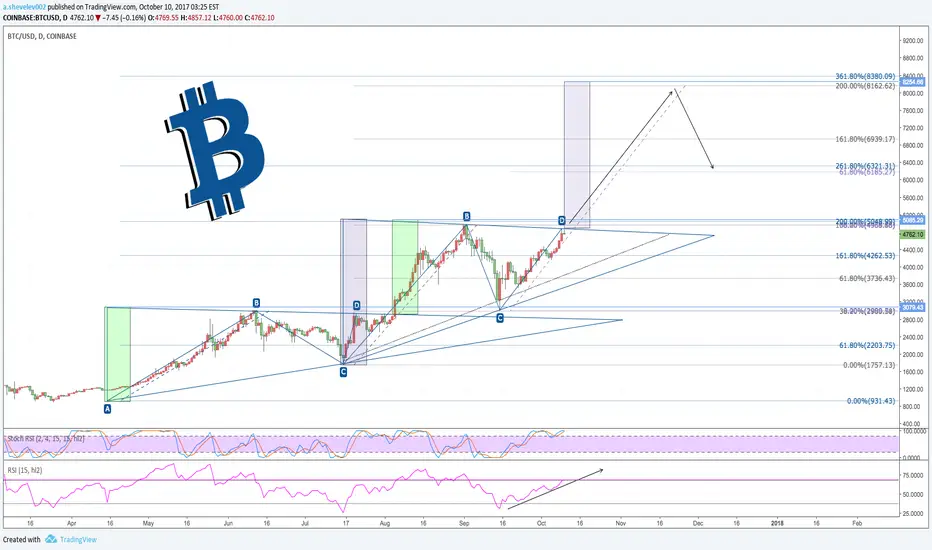
We can see 2 big Triangle patterns and Fibonacci levels on chart. Measuring hight of triangle we can calculate next price.
Achieved price meets Fibonacci levels.
To confirm upward movement, price should break 5000 level, and watch close for daily RSI.
Good luck
We can see 2 big Triangle patterns and Fibonacci levels on chart. Measuring hight of triangle we can calculate next price.
Achieved price meets Fibonacci levels.
To confirm upward movement, price should break 5000 level, and watch close for daily RSI.
Good luck
Note
5000k for bullsTrade active
Trade active
You can build your long positions.Working with Fibonacci levels
Trade active
Note
Rebuy on 5000 price level for long positionNote
6300 level reachedTrade closed: target reached
📲 Join Telegram Trading Community: t.me/+5hlxWmhHaKplN2Rk
🎙️ 𝘾𝙊𝙈𝙄𝙉𝙂 𝙎𝙊𝙊𝙉 Daily Live Streams on 🔴 𝗬𝗼𝘂𝗧𝘂𝗯𝗲
🔍 linktr.ee/artemcrypto ✅
🎙️ 𝘾𝙊𝙈𝙄𝙉𝙂 𝙎𝙊𝙊𝙉 Daily Live Streams on 🔴 𝗬𝗼𝘂𝗧𝘂𝗯𝗲
🔍 linktr.ee/artemcrypto ✅
Related publications
Disclaimer
The information and publications are not meant to be, and do not constitute, financial, investment, trading, or other types of advice or recommendations supplied or endorsed by TradingView. Read more in the Terms of Use.