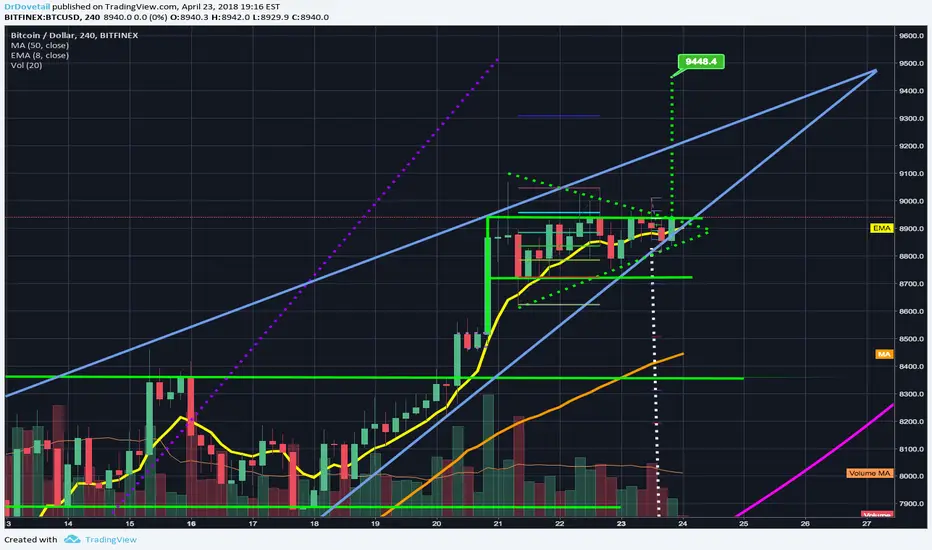
A very good sign as the 1 day candle manages to close as a bullish engulfing candle, and also finds a way to close just above the most recent 4hr bullflag. This greatly increases our odds of a bullish breakout from this flag and as you can see by the vertical dotted green line the projected breakout target should give us enough momentum to hopefully escape the rising wedge the price action has been trapped in recently with a breakout upward instead of the typicall downward break most rising wedges tend to break. Many people questioned why I went with the normal flag which is using the candle bodies as trendlines in stead of using the wicks as trendlines and going by the symmetrical triangle pattern. I personally find more success with flags and wedges when the trendlines adhere to te bodies and not the wicks...but sometimes the wicks will be the prevailing trend...this flag/triangle had morphed back and forth so many times over it's 3 day consolidation that I decided to put both possible shapes overlapping eachother and the funny thing is it turned out they were both valid and both had the exact same breakout target. It goes to show you that both trendlines that stick to the wicks and trendlines that go by the bodies of the candles can be valid...an in this specific case they can simultaneously be valid. Anyways, after all the cup and handles forming and triggering around the alt coin market today as I pointed out in a previous idea, i think that is a great sign that we have much more bullish climbing to be done. We may have a retracement to reset rsi, stoch, andd mach d levels back to favorable positions for a climb for part of this 1 day candle but I have a feeling this upcoming 1 day candle should be quite bullish and anticipate we will finally go Super Sayian mode again (OVER NINE THOOOOOUSSSAND!) during this new 1 day candle. Of course these are just my personal assumptions and not emant to be taken as financial advice so you make your own decisions and I'll make mine. Best of luck and thanks for reading!
Note
s3.amazonaws.com/tradingview/snapshots/v/VlmTC0tU.png As expected we are over nine thoooousand! The breakout from the bullflag/symmetrical triangle hybrid has kicked in and shot us all the way above the top trendline of the rising wedge, before the rising wedge's extremely strong resistance kicked in and it dragged the price action back down below it for the time being. This breakout should see us reach at least the projected breakout target of $9,448 but we are currently seeing expected resistance at the top trend line of the rising wedge pattern. I'm confident we can find a way to break above it on the next 4hr candle to reach our projected target but we need to keep a watchful eye on it should it continue to hold resistance and act accordingly. If we can reach our target and at the same time break out bullishly above the rising wedge the projected price target from that breakout could send us up over 10,000 although there will be quite a battle at the psychological resistance of 10,000! Alts are trigger cup and handle patterns left and right and I hope people had an opportunity to pick up any of the alts I reccomended earlier today because they are all doing extremely well right now.Note
One other important thing to mention the white dotted line on the image I just posted above, is the neckline of the Adam and Eve double bottom I've been following closely since the beginning of April. It's looking more and more likely that we may indeed validate that pattern and when that happens...sky is the limit. However we already triggered the weekly breakout which should be enough to shoot us up to the 18,000s eventually anyways.. so buckle up and enjoy the climb...but be ready for retracements along the way.Disclaimer
The information and publications are not meant to be, and do not constitute, financial, investment, trading, or other types of advice or recommendations supplied or endorsed by TradingView. Read more in the Terms of Use.
Disclaimer
The information and publications are not meant to be, and do not constitute, financial, investment, trading, or other types of advice or recommendations supplied or endorsed by TradingView. Read more in the Terms of Use.