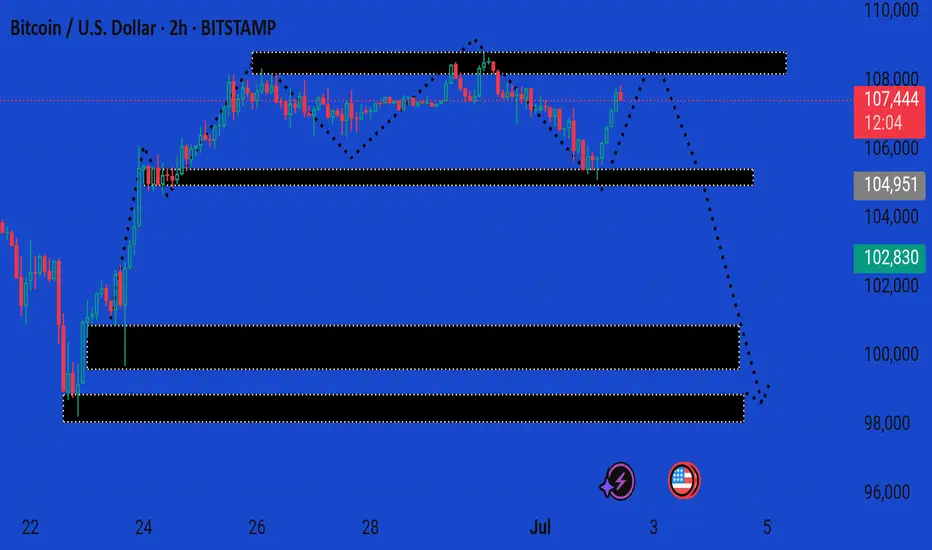
This is a 2-hour BTC/USD (Bitcoin to US Dollar) chart showing a bearish projection after a consolidation phase. Here's a breakdown of the analysis:
---
🔍 Current Price:
107,549 USD
Up +1.74%, suggesting a recent bullish push — likely a short-term rally.
---
🧠 Technical Zones & Forecast:
1. Resistance Zone (~107,500–109,000):
This area has been tested multiple times.
The dotted arrow from this level suggests a projected reversal, possibly forming a lower high.
2. First Demand/Support Zone (~104,800–105,200):
Shallow support. If broken, it may confirm the start of a deeper correction.
3. Second Demand Zone (~101,500–102,800):
More robust support.
Could serve as a bounce zone or long-entry area.
4. Third Major Demand Zone (~97,500–99,000):
Strong long-term support; a bearish target if momentum increases.
---
🧭 Directional Bias:
The dotted line shows a bearish trajectory with targets at 104.9k, 102.8k, and potentially 99k.
The price action reflects a distribution range at the top, hinting at potential markdown phase starting soon.
---
✅ Conclusion:
Short-term bullish, but showing signs of weakness near resistance.
Watch for rejection around 108k–109k to confirm the bearish move.
Breakdown below 104.9k would accelerate downside toward 102.8k and 99k.
Let me know if you'd like entry/exit signals or stop-loss suggestions based on this outlook.
---
🔍 Current Price:
107,549 USD
Up +1.74%, suggesting a recent bullish push — likely a short-term rally.
---
🧠 Technical Zones & Forecast:
1. Resistance Zone (~107,500–109,000):
This area has been tested multiple times.
The dotted arrow from this level suggests a projected reversal, possibly forming a lower high.
2. First Demand/Support Zone (~104,800–105,200):
Shallow support. If broken, it may confirm the start of a deeper correction.
3. Second Demand Zone (~101,500–102,800):
More robust support.
Could serve as a bounce zone or long-entry area.
4. Third Major Demand Zone (~97,500–99,000):
Strong long-term support; a bearish target if momentum increases.
---
🧭 Directional Bias:
The dotted line shows a bearish trajectory with targets at 104.9k, 102.8k, and potentially 99k.
The price action reflects a distribution range at the top, hinting at potential markdown phase starting soon.
---
✅ Conclusion:
Short-term bullish, but showing signs of weakness near resistance.
Watch for rejection around 108k–109k to confirm the bearish move.
Breakdown below 104.9k would accelerate downside toward 102.8k and 99k.
Let me know if you'd like entry/exit signals or stop-loss suggestions based on this outlook.
t.me/+EQ88IkMSUvQwMGJk
Join telegram channel free
t.me/+EQ88IkMSUvQwMGJk
Join telegram channel free
t.me/+EQ88IkMSUvQwMGJk
Disclaimer
The information and publications are not meant to be, and do not constitute, financial, investment, trading, or other types of advice or recommendations supplied or endorsed by TradingView. Read more in the Terms of Use.
t.me/+EQ88IkMSUvQwMGJk
Join telegram channel free
t.me/+EQ88IkMSUvQwMGJk
Join telegram channel free
t.me/+EQ88IkMSUvQwMGJk
Disclaimer
The information and publications are not meant to be, and do not constitute, financial, investment, trading, or other types of advice or recommendations supplied or endorsed by TradingView. Read more in the Terms of Use.
