Finally, we have some MeatBulls for our hungry Bitcoin tiger.
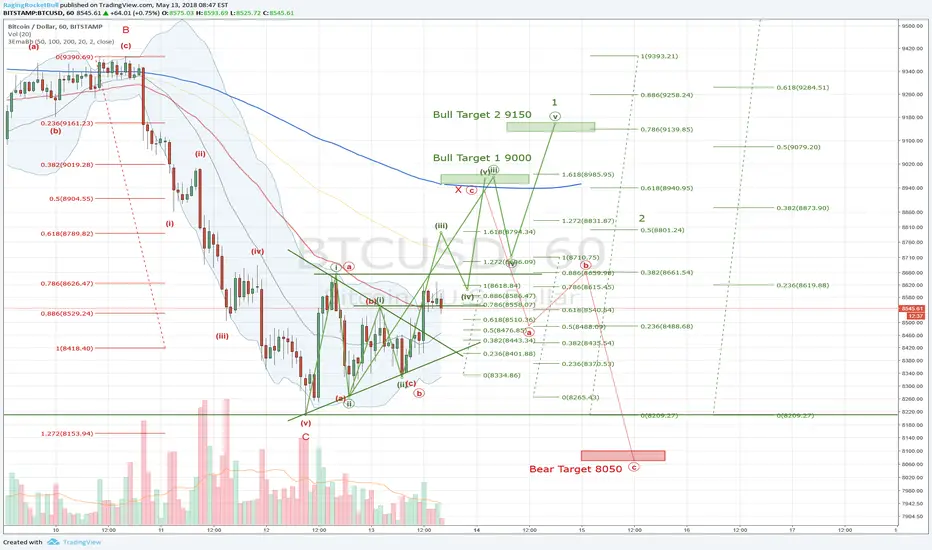
We have reached Bear Target 8200 (50% retracement) in an ABC correction as expected, and bulls are now defending this level because further decline may trigger a down trend on a larger scale.
Bulls have gained support on EMA 50 already and plan to push the price above EMA 200 in wave iii (circle) with targets 9000 (1.618 of wave i) and 9150 (wave v = 100% of wave i).
In case we are rejected by EMA 200 the move up will become a wave X with further decline to 8500 and Bear target 8050.
Key levels to watch: 8650 and EMA 200 (currently 8950).
Breaking 8550 has added bullish bias to the market - we started making higher highs and higher lows - that's an up trend by definition.
Breaking 8650 and gaining support on EMA 100 (yellow line) will confirm a further move up. The EMAs are flattening making it all possible. Watch Bitcoin hop from one to another.
Going below EMA 50 (red line), breaking 8400 triangle mean and the green trend line will discard the move up as correction with a fakeout and confirm bearish scenario.
Note that we can have an (abc) flat with truncated (c) instead of (i ii)
Also note that we don't have a death cross immediately after a golden cross on a daily! We have a near miss of EMAs and will likely go to the up side now.
And there are already 2 green candles on a daily meaning that the 3rd candle with a strong push up may be coming soon.
We have a thick ichimoku resistance cloud above us on H1 so we might not make it to the up side. But if we do the cloud's upside is flat and can serve as a spring.
On the other hand, we are in the thick of a support cloud on a Daily and simply can't go down a lot.
That's why you can see multiple weak and strong ichimoku MA crosses on H1 negating each other.
Another thing to keep in mind:
M15 EMA 200 = H1 EMA 50
H1 EMA 200 = H4 EMA 50
H4 EMA 200 = D1 EMA 50
because 200 is 4x 50 and H4 is 4x H1 and etc.
So you can get you BEARings from either timeframe.
We have 12 days until the 25th - next CME Futures expiration date. The pump may start soon the same way as it did at 6400, provided they went long and want the price to move up.
Good Luck!
This is not a financial advice! Please don't trade based only on my analysis. Do your own research.
Note
We've successfully breached but ultimately were rejected by EMA 100. The up trend is invalidated (wave iv has moved past wave i and it's not a leading wedge either). This whole structure was a wxy (or abc) correction upwards with another abc in its wave y. It's now possibly have become a wave X. We're hanging by a thread and are likely to go down in another abc of wave A. Possible death cross on D1 may trigger a sell-off and a longer term down trend.
Note
I don't see this sudden move up as an up trend. It's an upwards correction and is not sustainable in the long run - we will be rejected by EMA 200. It's probably because ETHUSD had to have its wave 5 up. Seems like a Wyckoff's trading range in a choppy market with a change of character, sudden 100% up/down moves and last point of supply LPSY. Down to 61.8% (7750) is the only way. This only proves that the market makers have many tricks up their sleeves.Note
We have breached the target 61.8% 7750 and completed complex correction. This is the last chance for the bulls to revive the up trend. The next support level is 78.6% at 7200 (also the end of wave i). Volume Profile shows HVN nodes at 6800-7000, so breaking 7600 (relatively no volume) and then 7500 (end of wave 1) will likely mean further decline to 7000 which is also the trend line support of a giant triangle.RSI is oversold on H1,H4, still room to go down on D1. Also Bearish death cross on D1. If 7200 holds we can still form a bottom and bounce up.
Disclaimer
The information and publications are not meant to be, and do not constitute, financial, investment, trading, or other types of advice or recommendations supplied or endorsed by TradingView. Read more in the Terms of Use.
Disclaimer
The information and publications are not meant to be, and do not constitute, financial, investment, trading, or other types of advice or recommendations supplied or endorsed by TradingView. Read more in the Terms of Use.