Bitcoin's Podium-Ready 'Bull Flag' Hints at Price Boom to $120K
Bitcoin, the pioneering cryptocurrency that has redefined the financial landscape, continues to spark intense debate and fervent speculation about its future price trajectory. Amidst the sea of technical analyses and market predictions, a compelling pattern has emerged on Bitcoin's price chart: the 'bull flag.' This bullish continuation pattern, often seen as a precursor to significant upward price movements, has ignited excitement among Bitcoin proponents, fueling predictions of a potential surge to $120,000.
This article delves into the intricacies of the bull flag pattern, exploring its formation, characteristics, and implications for Bitcoin's price. We will analyze the current market conditions, considering the recent retreat from $108,000 and the overall sentiment of Bitcoin bulls. Furthermore, we will examine the factors that could either validate or invalidate the bull flag pattern, providing a nuanced perspective on the potential for Bitcoin to reach $120,000. By synthesizing these insights, we aim to offer a comprehensive overview of the technical and fundamental factors that could shape Bitcoin's price trajectory in the coming months.
Understanding the Bull Flag Pattern
The bull flag is a technical analysis pattern that signals a continuation of an existing uptrend. It is characterized by two distinct phases:
1. The Flagpole: This represents the initial strong upward movement in price. It is a sharp, almost vertical rally that establishes the overall bullish trend.
2. The Flag: This is a period of consolidation that follows the flagpole. The price moves sideways or slightly downwards, forming a rectangular or parallelogram-shaped pattern that resembles a flag. This consolidation phase allows the market to digest the initial rally and prepare for the next leg up.
The bull flag pattern is considered a bullish signal because it suggests that the initial uptrend is likely to resume after the consolidation phase. Traders often look for a breakout above the upper trendline of the flag as a confirmation signal to enter a long position.
Bitcoin's Bull Flag Formation
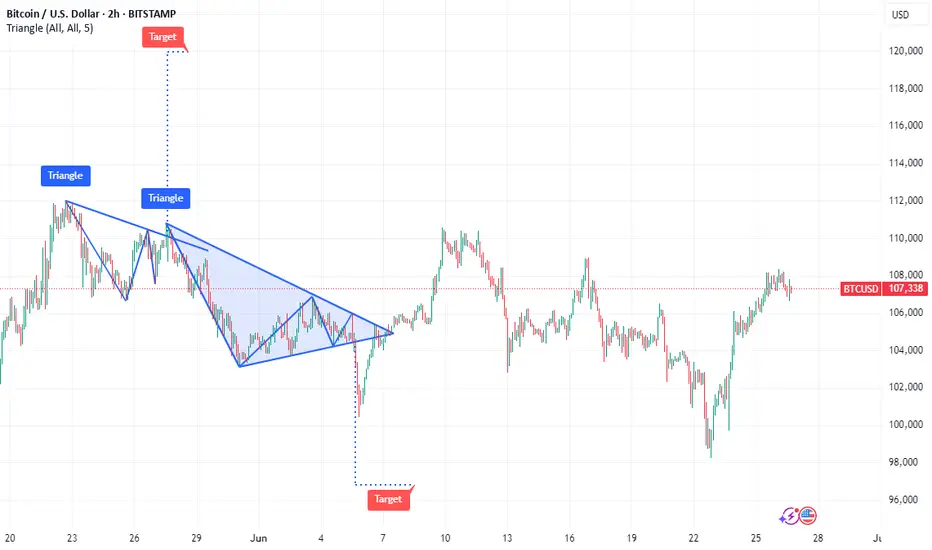
Bitcoin's price chart has exhibited a pattern that closely resembles a bull flag. The flagpole can be identified by the significant upward movement that occurred in the months leading up to June 2025. This rally propelled Bitcoin to a high of $108,000, establishing a strong bullish trend.
Following this rally, Bitcoin entered a period of consolidation, with the price moving sideways and slightly downwards. This consolidation phase has formed a flag-like pattern on the chart, characterized by two parallel trendlines that slope gently downwards.
The formation of this bull flag pattern has led many analysts to believe that Bitcoin is poised for another significant upward movement. The target price for this potential breakout is often calculated by measuring the length of the flagpole and adding it to the breakout point on the upper trendline of the flag. In Bitcoin's case, this calculation suggests a potential target price of around $120,000.
Factors Supporting the Bull Flag Pattern
Several factors support the validity of the bull flag pattern and the potential for Bitcoin to reach $120,000:
• Strong Underlying Bullish Trend: The bull flag is a continuation pattern, meaning that it relies on an existing uptrend to be valid. Bitcoin's price has been in a strong uptrend for several years, driven by increasing institutional adoption, growing mainstream adoption, and limited supply.
• Positive Market Sentiment: The overall sentiment among Bitcoin investors remains positive, despite the recent retreat from $108,000. Many analysts believe that Bitcoin is still in the early stages of its adoption curve and that its long-term potential remains significant.
• Increasing Institutional Adoption: Institutional investors, such as hedge funds, pension funds, and corporations, are increasingly allocating capital to Bitcoin. This increased institutional adoption can drive up the price of Bitcoin and provide a more stable foundation for its long-term growth.
• Growing Mainstream Adoption: Bitcoin is becoming increasingly accepted as a form of payment and a store of value by mainstream consumers and businesses. This growing mainstream adoption can increase demand for Bitcoin and drive up its price.
• Limited Supply: Bitcoin has a fixed supply of 21 million coins. This limited supply makes Bitcoin a scarce asset, which can increase its value over time as demand grows.
• Halving Events: Bitcoin's halving events, which occur approximately every four years, reduce the rate at which new Bitcoins are created. These halving events can reduce the supply of Bitcoin and drive up its price. The next halving event is expected to occur in 2028.
• Macroeconomic Factors: Macroeconomic factors, such as inflation, currency devaluation, and geopolitical instability, can increase demand for Bitcoin as a safe haven asset.
Factors Invalidating the Bull Flag Pattern
While the bull flag pattern is a bullish signal, it is not foolproof. Several factors could invalidate the pattern and prevent Bitcoin from reaching $120,000:
• Breakdown Below the Flag: If the price breaks down below the lower trendline of the flag, the bull flag pattern is invalidated. This would suggest that the consolidation phase is not a temporary pause before another rally, but rather a sign of weakening momentum.
• Negative News and Events: Negative news and events, such as regulatory crackdowns, security breaches, or macroeconomic shocks, could dampen investor sentiment and trigger a sell-off in Bitcoin.
• Weakening Market Fundamentals: If Bitcoin's adoption rate slows down, network activity declines, or transaction volume decreases, it could indicate that the underlying fundamentals are weakening, which could invalidate the bull flag pattern.
• Profit-Taking: After a significant rally, some investors may choose to take profits, which could put downward pressure on the price of Bitcoin and prevent it from breaking out of the flag.
• Alternative Investments: The emergence of compelling alternative investments could divert capital away from Bitcoin, reducing demand and potentially invalidating the bull flag.
Bitcoin Retreats From $108K: A Temporary Setback?
As of June 26, 2025, Bitcoin has retreated from its recent high of $108,000. This pullback has sparked concerns among some investors, but Bitcoin bulls remain optimistic about the long-term prospects of the cryptocurrency.
The recent retreat could be attributed to a number of factors, including profit-taking after a significant rally, regulatory concerns, or macroeconomic headwinds. However, it is important to note that Bitcoin has experienced numerous pullbacks throughout its history, and these pullbacks have often been followed by even stronger rallies.
The key question is whether this pullback is a temporary setback within the bull flag pattern or a sign that the pattern is about to be invalidated. If the price can hold above the lower trendline of the flag and eventually break out above the upper trendline, it would confirm the validity of the pattern and increase the likelihood of Bitcoin reaching $120,000.
Trading the Bull Flag Pattern
Traders who are looking to capitalize on the bull flag pattern can consider the following strategies:
• Entry Point: Wait for a confirmed breakout above the upper trendline of the flag before entering a long position. This helps to avoid false breakouts and increases the probability of a successful trade.
• Stop-Loss Order: Place a stop-loss order below the lower trendline of the flag to limit potential losses if the pattern is invalidated.
• Target Price: Calculate the target price by measuring the length of the flagpole and adding it to the breakout point on the upper trendline of the flag.
• Risk Management: Always use proper risk management techniques, such as limiting the amount of capital you risk on any single trade.
Conclusion
Bitcoin's price chart is currently exhibiting a bull flag pattern, which suggests that the cryptocurrency could be poised for another significant upward movement. The potential target price for this breakout is around $120,000.
However, it is important to note that the bull flag pattern is not foolproof, and several factors could invalidate it. Investors should carefully monitor the price action, market sentiment, and underlying fundamentals to assess the likelihood of Bitcoin reaching $120,000.
The recent retreat from $108,000 is a reminder that Bitcoin is a volatile asset and that pullbacks are a normal part of the market cycle. Whether this pullback is a temporary setback within the bull flag pattern or a sign that the pattern is about to be invalidated remains to be seen.
Ultimately, the future of Bitcoin's price will depend on a complex interplay of technical factors, market sentiment, and fundamental developments. By staying informed and using proper risk management techniques, investors can position themselves to potentially profit from Bitcoin's continued growth and success. As always, remember to consult with a qualified financial advisor before making any investment decisions. The bull flag offers a tantalizing glimpse of potential gains, but prudent analysis and risk mitigation are essential for navigating the volatile world of cryptocurrency.
Bitcoin, the pioneering cryptocurrency that has redefined the financial landscape, continues to spark intense debate and fervent speculation about its future price trajectory. Amidst the sea of technical analyses and market predictions, a compelling pattern has emerged on Bitcoin's price chart: the 'bull flag.' This bullish continuation pattern, often seen as a precursor to significant upward price movements, has ignited excitement among Bitcoin proponents, fueling predictions of a potential surge to $120,000.
This article delves into the intricacies of the bull flag pattern, exploring its formation, characteristics, and implications for Bitcoin's price. We will analyze the current market conditions, considering the recent retreat from $108,000 and the overall sentiment of Bitcoin bulls. Furthermore, we will examine the factors that could either validate or invalidate the bull flag pattern, providing a nuanced perspective on the potential for Bitcoin to reach $120,000. By synthesizing these insights, we aim to offer a comprehensive overview of the technical and fundamental factors that could shape Bitcoin's price trajectory in the coming months.
Understanding the Bull Flag Pattern
The bull flag is a technical analysis pattern that signals a continuation of an existing uptrend. It is characterized by two distinct phases:
1. The Flagpole: This represents the initial strong upward movement in price. It is a sharp, almost vertical rally that establishes the overall bullish trend.
2. The Flag: This is a period of consolidation that follows the flagpole. The price moves sideways or slightly downwards, forming a rectangular or parallelogram-shaped pattern that resembles a flag. This consolidation phase allows the market to digest the initial rally and prepare for the next leg up.
The bull flag pattern is considered a bullish signal because it suggests that the initial uptrend is likely to resume after the consolidation phase. Traders often look for a breakout above the upper trendline of the flag as a confirmation signal to enter a long position.
Bitcoin's Bull Flag Formation
Bitcoin's price chart has exhibited a pattern that closely resembles a bull flag. The flagpole can be identified by the significant upward movement that occurred in the months leading up to June 2025. This rally propelled Bitcoin to a high of $108,000, establishing a strong bullish trend.
Following this rally, Bitcoin entered a period of consolidation, with the price moving sideways and slightly downwards. This consolidation phase has formed a flag-like pattern on the chart, characterized by two parallel trendlines that slope gently downwards.
The formation of this bull flag pattern has led many analysts to believe that Bitcoin is poised for another significant upward movement. The target price for this potential breakout is often calculated by measuring the length of the flagpole and adding it to the breakout point on the upper trendline of the flag. In Bitcoin's case, this calculation suggests a potential target price of around $120,000.
Factors Supporting the Bull Flag Pattern
Several factors support the validity of the bull flag pattern and the potential for Bitcoin to reach $120,000:
• Strong Underlying Bullish Trend: The bull flag is a continuation pattern, meaning that it relies on an existing uptrend to be valid. Bitcoin's price has been in a strong uptrend for several years, driven by increasing institutional adoption, growing mainstream adoption, and limited supply.
• Positive Market Sentiment: The overall sentiment among Bitcoin investors remains positive, despite the recent retreat from $108,000. Many analysts believe that Bitcoin is still in the early stages of its adoption curve and that its long-term potential remains significant.
• Increasing Institutional Adoption: Institutional investors, such as hedge funds, pension funds, and corporations, are increasingly allocating capital to Bitcoin. This increased institutional adoption can drive up the price of Bitcoin and provide a more stable foundation for its long-term growth.
• Growing Mainstream Adoption: Bitcoin is becoming increasingly accepted as a form of payment and a store of value by mainstream consumers and businesses. This growing mainstream adoption can increase demand for Bitcoin and drive up its price.
• Limited Supply: Bitcoin has a fixed supply of 21 million coins. This limited supply makes Bitcoin a scarce asset, which can increase its value over time as demand grows.
• Halving Events: Bitcoin's halving events, which occur approximately every four years, reduce the rate at which new Bitcoins are created. These halving events can reduce the supply of Bitcoin and drive up its price. The next halving event is expected to occur in 2028.
• Macroeconomic Factors: Macroeconomic factors, such as inflation, currency devaluation, and geopolitical instability, can increase demand for Bitcoin as a safe haven asset.
Factors Invalidating the Bull Flag Pattern
While the bull flag pattern is a bullish signal, it is not foolproof. Several factors could invalidate the pattern and prevent Bitcoin from reaching $120,000:
• Breakdown Below the Flag: If the price breaks down below the lower trendline of the flag, the bull flag pattern is invalidated. This would suggest that the consolidation phase is not a temporary pause before another rally, but rather a sign of weakening momentum.
• Negative News and Events: Negative news and events, such as regulatory crackdowns, security breaches, or macroeconomic shocks, could dampen investor sentiment and trigger a sell-off in Bitcoin.
• Weakening Market Fundamentals: If Bitcoin's adoption rate slows down, network activity declines, or transaction volume decreases, it could indicate that the underlying fundamentals are weakening, which could invalidate the bull flag pattern.
• Profit-Taking: After a significant rally, some investors may choose to take profits, which could put downward pressure on the price of Bitcoin and prevent it from breaking out of the flag.
• Alternative Investments: The emergence of compelling alternative investments could divert capital away from Bitcoin, reducing demand and potentially invalidating the bull flag.
Bitcoin Retreats From $108K: A Temporary Setback?
As of June 26, 2025, Bitcoin has retreated from its recent high of $108,000. This pullback has sparked concerns among some investors, but Bitcoin bulls remain optimistic about the long-term prospects of the cryptocurrency.
The recent retreat could be attributed to a number of factors, including profit-taking after a significant rally, regulatory concerns, or macroeconomic headwinds. However, it is important to note that Bitcoin has experienced numerous pullbacks throughout its history, and these pullbacks have often been followed by even stronger rallies.
The key question is whether this pullback is a temporary setback within the bull flag pattern or a sign that the pattern is about to be invalidated. If the price can hold above the lower trendline of the flag and eventually break out above the upper trendline, it would confirm the validity of the pattern and increase the likelihood of Bitcoin reaching $120,000.
Trading the Bull Flag Pattern
Traders who are looking to capitalize on the bull flag pattern can consider the following strategies:
• Entry Point: Wait for a confirmed breakout above the upper trendline of the flag before entering a long position. This helps to avoid false breakouts and increases the probability of a successful trade.
• Stop-Loss Order: Place a stop-loss order below the lower trendline of the flag to limit potential losses if the pattern is invalidated.
• Target Price: Calculate the target price by measuring the length of the flagpole and adding it to the breakout point on the upper trendline of the flag.
• Risk Management: Always use proper risk management techniques, such as limiting the amount of capital you risk on any single trade.
Conclusion
Bitcoin's price chart is currently exhibiting a bull flag pattern, which suggests that the cryptocurrency could be poised for another significant upward movement. The potential target price for this breakout is around $120,000.
However, it is important to note that the bull flag pattern is not foolproof, and several factors could invalidate it. Investors should carefully monitor the price action, market sentiment, and underlying fundamentals to assess the likelihood of Bitcoin reaching $120,000.
The recent retreat from $108,000 is a reminder that Bitcoin is a volatile asset and that pullbacks are a normal part of the market cycle. Whether this pullback is a temporary setback within the bull flag pattern or a sign that the pattern is about to be invalidated remains to be seen.
Ultimately, the future of Bitcoin's price will depend on a complex interplay of technical factors, market sentiment, and fundamental developments. By staying informed and using proper risk management techniques, investors can position themselves to potentially profit from Bitcoin's continued growth and success. As always, remember to consult with a qualified financial advisor before making any investment decisions. The bull flag offers a tantalizing glimpse of potential gains, but prudent analysis and risk mitigation are essential for navigating the volatile world of cryptocurrency.
Get your free C++ High Frequency Trading ebook at
quantlabsnet.com/registration
Or talk me live 1 on 1 at wa.me/16477809447?text=Hi I saw you on TradingView and I got questions
quantlabsnet.com/registration
Or talk me live 1 on 1 at wa.me/16477809447?text=Hi I saw you on TradingView and I got questions
Related publications
Disclaimer
The information and publications are not meant to be, and do not constitute, financial, investment, trading, or other types of advice or recommendations supplied or endorsed by TradingView. Read more in the Terms of Use.