~Bitcoin macro cycles~
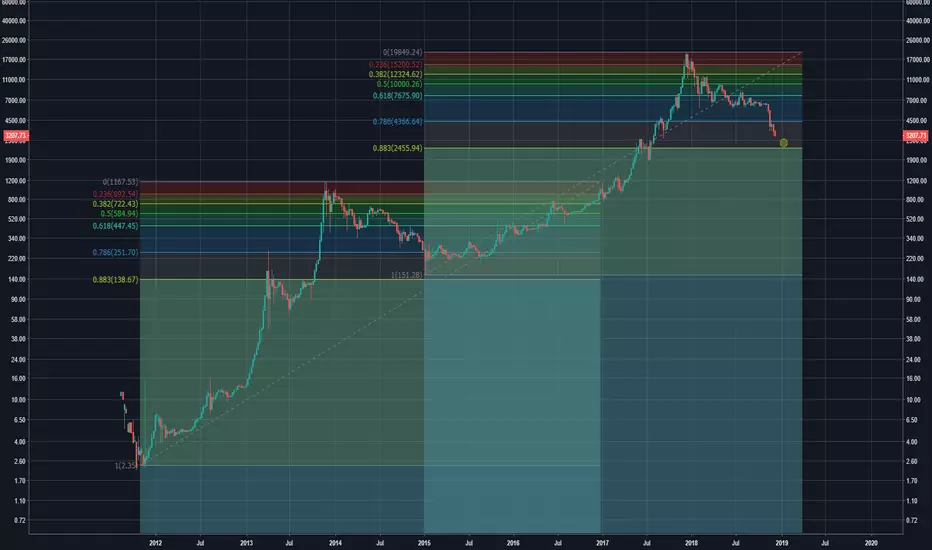
2013 bear market highlights:
87% pullback from peak ($1,162 - $152)
Took roughly 400 days to bottom out
Price found support right above .88 Fib level
2018 bear market prediction:
If we assume correlation between historical
price action and future price action,
BTC will find its bottom at between $2,500-$2,700 in mid January of 2019
This scenario would satisfy all three conditions of previous BTC bottoms
1) 87% selloff ($20,000 to $2,600)
2) 400 days from highest high to lowest low
3) Price bouncing right above the .88 Fib level
Give a like and a follow if you found this TA interesting and would like to see more of my content. I will be doing more charting like this going into 2019 and beyond. Cheers!
___________________________
*This is not investment advice*
Disclaimer
The information and publications are not meant to be, and do not constitute, financial, investment, trading, or other types of advice or recommendations supplied or endorsed by TradingView. Read more in the Terms of Use.
Disclaimer
The information and publications are not meant to be, and do not constitute, financial, investment, trading, or other types of advice or recommendations supplied or endorsed by TradingView. Read more in the Terms of Use.