Bitcoin 4H Rocket Boost Strategy – Bullish Setup with EMA Alignment, Gap Action, ADX Strength, and Stoch RSI Signal
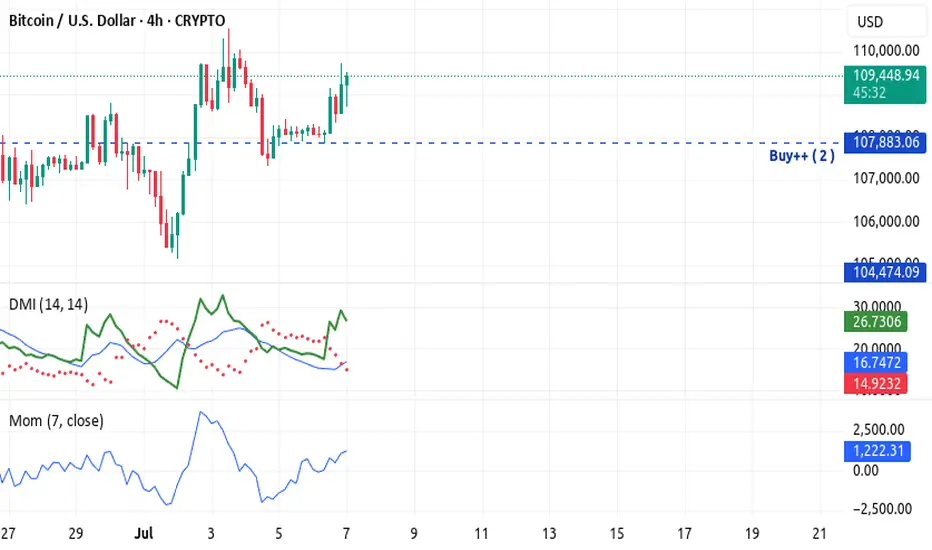
Bitcoin (BTC/USD) is currently displaying a textbook bullish setup on the 4-hour chart, closely matching the Rocket Boost Strategy
criteria. Traders using a trend-following system with momentum confirmation will find this setup particularly appealing.
1. Price Above the 50 EMA
Bitcoin is trading firmly above the 50 EMA, a key sign that short-term momentum is tilted in favor of the bulls. The 50 EMA often
acts as dynamic support during strong uptrends, and current price action respecting this level shows the market is in a healthy
bullish phase.
2. Price Above the 200 EMA
The long-term trend is also confirmed as bullish, with price positioned well above the 200 EMA. This alignment of the 50 and
200 EMAs forms what many traders call a “bullish stack,” which strengthens confidence in long opportunities.
3. Gap Action / Aggressive Breakout Behavior
While cryptocurrencies don't technically gap in the same way as stocks or forex (due to 24/7 trading), Bitcoin has shown strong
impulsive breakout candles with little to no wick retracement—often referred to as "synthetic gaps" or aggressive breakouts.
This behavior typically reflects institutional buying or whale-driven momentum entering the market suddenly.
4. ADX Indicator Confirms Trend Strength
The ADX (Average Directional Index) is rising above the 20–25 level, which indicates that the current trend is gaining strength. A
rising ADX while price moves higher means that the upward momentum is not just temporary noise—it’s a signal that buyers
are firmly in control.
5. Stochastic RSI Gives Reversal Buy Signal
The Stochastic RSI recently dipped into oversold territory and has now crossed back upward. This reversal buy signal, especially
when aligned with a trending environment, often marks the end of a short-term pullback and the beginning of a new impulse leg upward.
What This Means for Bitcoin Traders
When all these components align—price above both EMAs, strong ADX trend, breakout behavior, and a fresh Stoch RSI buy
signal—it often results in what traders using the Rocket Boost Strategy refer to as a “momentum ignition point.” It’s not just a
signal to enter, but a signal that the market may accelerate in the current direction.
This could lead Bitcoin to test new resistance zones or even break psychological levels if volume supports the move. Key zones to
watch would be previous highs and Fibonacci extensions drawn from the most recent swing.
Disclaimer: This article is for educational purposes only and does not constitute financial advice. Always perform your own due
diligence and use proper risk management when trading.
To learn more about this kind of setup, search for Rocket Boost Strategy content.
Related publications
Disclaimer
The information and publications are not meant to be, and do not constitute, financial, investment, trading, or other types of advice or recommendations supplied or endorsed by TradingView. Read more in the Terms of Use.
Related publications
Disclaimer
The information and publications are not meant to be, and do not constitute, financial, investment, trading, or other types of advice or recommendations supplied or endorsed by TradingView. Read more in the Terms of Use.