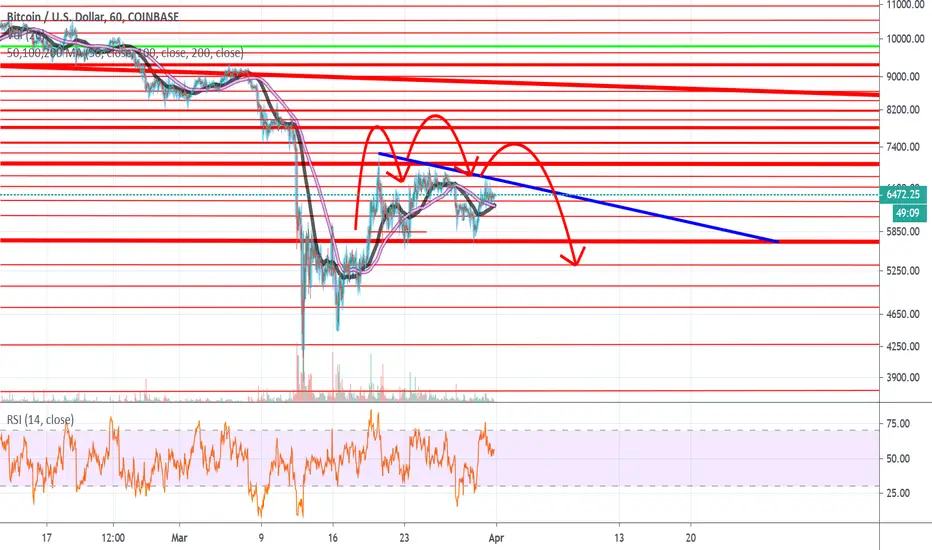
Bitcoin appears to have a hard time breaking above the downward slonping resistance, which is forming a descending triangle or bullish flag.
The RSI is at a level where we've seen rejection multiple times in the past, and there may be a H&S pattern shaping in addition to the descending triangle.
The RSI is at a level where we've seen rejection multiple times in the past, and there may be a H&S pattern shaping in addition to the descending triangle.
Note
Same chart but on a 5 day.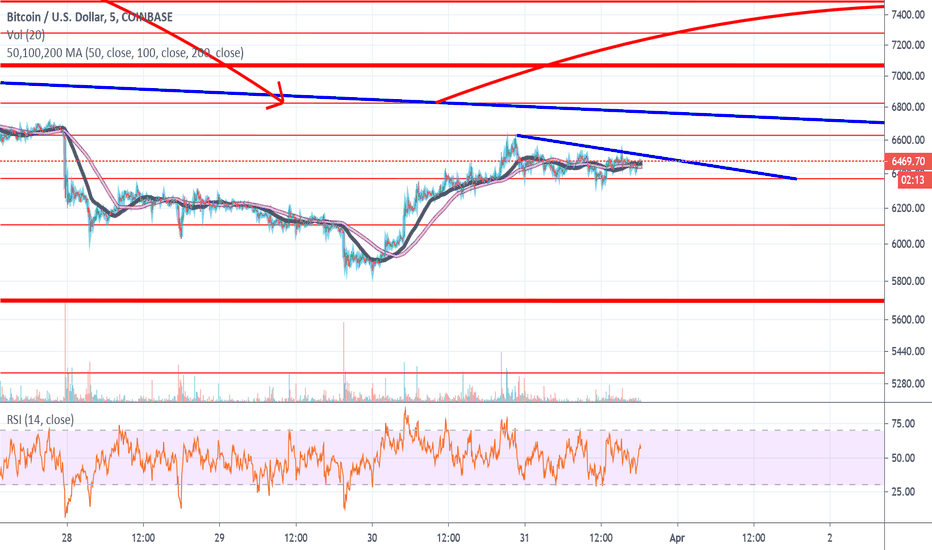
Note
Bullish Flag or Descending Triangle.
Disclaimer
The information and publications are not meant to be, and do not constitute, financial, investment, trading, or other types of advice or recommendations supplied or endorsed by TradingView. Read more in the Terms of Use.
Disclaimer
The information and publications are not meant to be, and do not constitute, financial, investment, trading, or other types of advice or recommendations supplied or endorsed by TradingView. Read more in the Terms of Use.