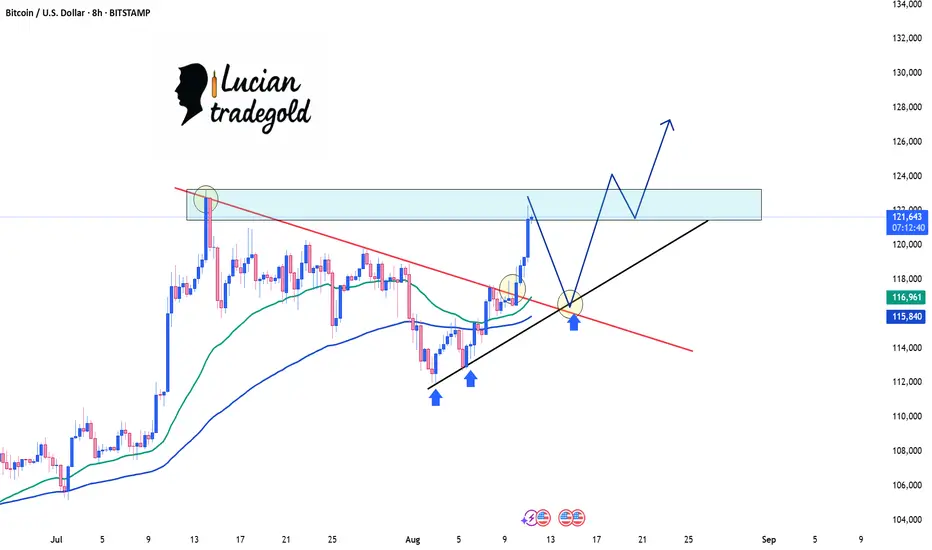
Looking at Bitcoin (BTC/USD) on the 8-hour chart, we’re witnessing some exciting action as BTC edges closer to a critical resistance zone, just below $122,000. This level has previously seen rejection, but the bulls are making a strong push with increasing momentum.
Key Levels to Watch:
Resistance Zone: $121,500 - $122,000 (previous rejection area)
Support Trendline: The strong black diagonal line, providing solid support since mid-July.
What’s Happening Now?
Bitcoin has just broken above the crucial trendline, suggesting a possible continuation of the bullish momentum.
The price action around the $121,500 zone is crucial: a clean breakout above this level could trigger a surge towards $124,000 and beyond.
What’s Next?
If BTC breaks and closes above the $122,000 level, we can expect a continuation towards new highs.
Watch out for potential pullbacks to the trendline for a retest before jumping in for long positions.
Trading Strategy:
Look for a breakout confirmation above $122,000, with potential targets at $124,000 and even $130,000 in the longer term.
Stop-loss should be placed just below the trendline support ($116,500) to manage risk efficiently.
Key Takeaway: Bitcoin is gearing up for a potential breakout, but patience is key! Let’s keep an eye on the market as we approach that critical resistance zone.
💬 What’s your take on Bitcoin's next move? Will it break the resistance, or is this just another fakeout? Drop your thoughts in the comments below!
⭐️Join our FREE Signal Channel for instant benefits:
t.me/+E4ZNW3ZeXiQ1Y2M9
✅80% Win Rate Signals - Free, high-quality signals to boost your success.
✅Expert Trading Strategies
✅Exclusive Tips & Insights
t.me/+E4ZNW3ZeXiQ1Y2M9
✅80% Win Rate Signals - Free, high-quality signals to boost your success.
✅Expert Trading Strategies
✅Exclusive Tips & Insights
Related publications
Disclaimer
The information and publications are not meant to be, and do not constitute, financial, investment, trading, or other types of advice or recommendations supplied or endorsed by TradingView. Read more in the Terms of Use.