Bitcoin Slightly Bullish, but Overall Ranging
bitcoin seems to be ranging. Bullish and bearish indicators seem somewhat weak at this point.
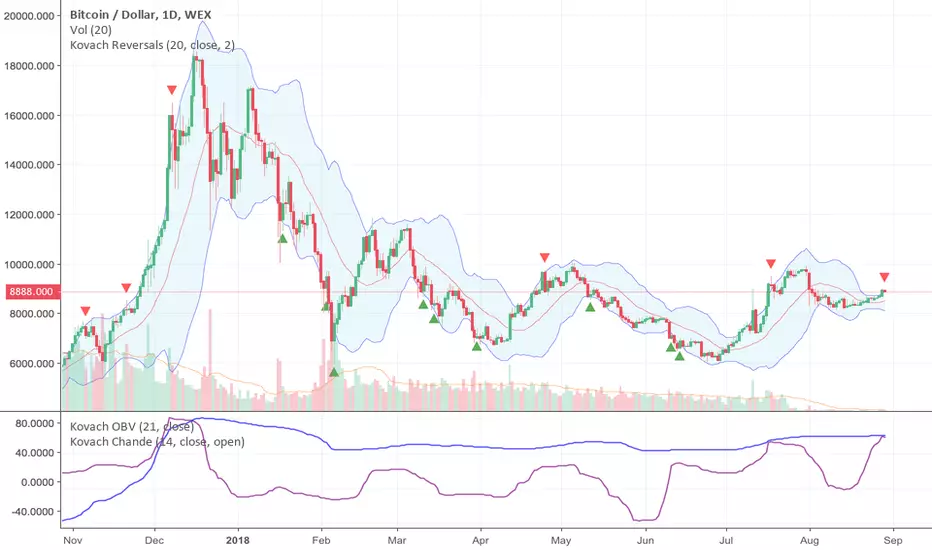
At the time of this writing, bitcoin was trading at $7096.28.
Levels from above will provide resistance, including:
7109.56 from volume profile over the past 14 periods
8272.26 from highs and lows over the past 30 periods
8562.41 from highs and lows over the past 100 periods
9964.50 from highs and lows
Levels from above include::
6962.89 from sma 50
6887.55 from volume profile over the past 14 periods
6864.78 from volume profile over the past 14 periods
6807.85 from volume profile over the past 14 periods
6779.39 from volume profile over the past 14 periods
6756.62 from volume profile over the past 14 periods
6711.08 from volume profile over the past 14 periods
5971.05 from highs and lows over the past 14 periods
5826.41 from highs and lows over the past 100 periods
Lets look at some technical analysis for bitcoin. Volatility has narrowed considerably, which suggests a breakout may be near. The RSI is 59, indicating that we are in a bull trend, but not yet overbought. The MACD is above the signal line, but not by too much, suggesting that we are in a bull trend which may continue. bitcoin is above the 50 period SMA, which indicates a bull trend, but not overbought yet. Also, bitcoin is above the 100 period SMA, which is currently at 6953, indicating bullishness. Finally, the SMA(50) is roughly equal to the SMA(100), suggesting ranging. The ADX indicator suggests a meager bull trend, at 28.
Join my discord at discord.io/quantguy
Disclaimer
The information and publications are not meant to be, and do not constitute, financial, investment, trading, or other types of advice or recommendations supplied or endorsed by TradingView. Read more in the Terms of Use.
Join my discord at discord.io/quantguy
Disclaimer
The information and publications are not meant to be, and do not constitute, financial, investment, trading, or other types of advice or recommendations supplied or endorsed by TradingView. Read more in the Terms of Use.