My last post was about how I was hoping to catch the retest of the 1D Double Top bullish wave to 112.3K, well now that position is DONE!. It has hit my target TP.
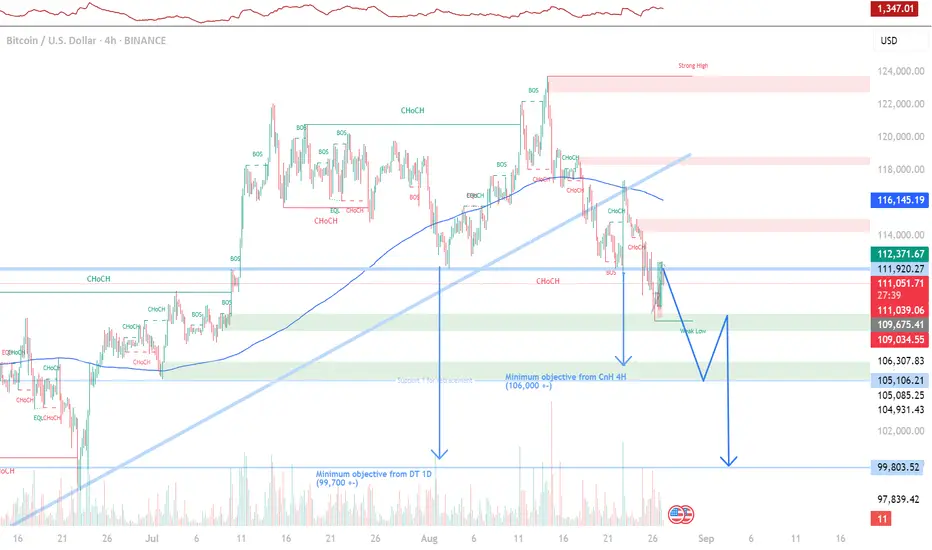
To continue, I have entered a Short at 112.1K with a Stop Loss at 113K, which is right above the short order block. I was able to enter at a good position this morning because i caught a 15m Reversal Candle with a declining volume during the push up. Not long after that, the 15m timeframe shows a Head and Shoulders Pattern with agreement with its volume. and lucky for me I entered at the head! In the hopes of having a TP at 106.9K (or even more!). This TP is based on the minimum objective of the Reverse Cup and Handle formation in 4H.
In this position, the first challenge would be breaking the Support Line at around 109.5K, which is quite significant as it was touched a handful of times.
When the price reaches 107K i will monitor the momentum to see if I should take the TP at 106.9K or extend my TP to 99.8K. Because right now there is a Double-Top minimum objective of 99.8K. I also did a Fibonacci Analysis that shows it actually might go lower than 99.8K. However, to me, it all depends on the price action then. I don't wanna be greedy and we can always set up new positions later on.
Happy Trading!
Note
Update: if you check out the Bollinger's Band at the peak of the retest in the 15m timeframe while using John Bollinger's Recommended band setup which is 20 Timeframe with 2 Standard Deviation. You can see that the price crossed over the band on the upside, and then it entered back in. Now, usually this means exhaustion or a continuation of the trend. However, the price formed an Inverse Cup and Handle as it entered the band again. To my understanding, a move like this signifies a reversal. Luckily In this case, BEARISH!Trade active
Don't Panic! I believe this is a liquidity sweep towards the upside. It's forming a Flat-Bottom Triangle now, volume is holding pretty well. It's not showing heavy volume on the upwards movements so i guess we are good to go!Note
Currently 9PM GMT+7 Time, as you can see there is heavy momentum and confirmation candles in 1H on the downside break for the 1D double top.Note
Currently 6PM GMT+7 Time. There was a liquidity sweep on the upside. Heavy Volume too! but the resistance at 110,000 is quite significant so there is nothing to worry about. Happy Trading!Disclaimer
The information and publications are not meant to be, and do not constitute, financial, investment, trading, or other types of advice or recommendations supplied or endorsed by TradingView. Read more in the Terms of Use.
Disclaimer
The information and publications are not meant to be, and do not constitute, financial, investment, trading, or other types of advice or recommendations supplied or endorsed by TradingView. Read more in the Terms of Use.