Welcome back to another deep-dive analysis powered by MMC (Mirror Market Concepts), where precision meets market psychology. In today’s BTCUSD setup, we’re observing a textbook confluence of structural breakouts, demand rejections, and liquidity zone engagements. Let’s break it down step by step.
📊 1. Market Context & Background
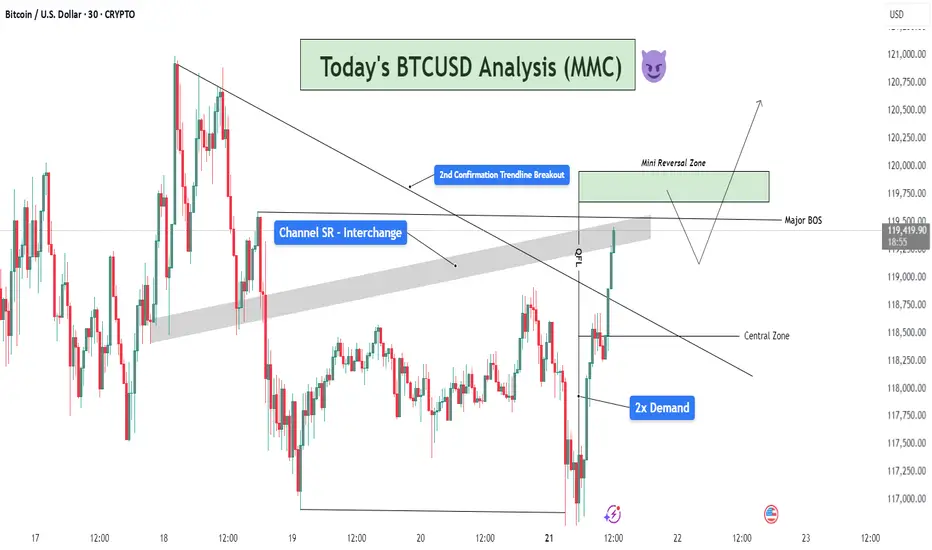
The market recently showed a prolonged bearish trendline structure, with lower highs compressing price into a wedge. The prior days have been consolidative, hinting at an accumulation phase. This forms the foundation for reversal setups we often identify in MMC-style analysis — where liquidity, not just structure, determines the next move.
🔍 2. Demand Zone Dominance – 2x Tap Confirmation
At the bottom of the chart, BTC created a strong 2x Demand Zone (117,250–118,000 area), a region where buyers aggressively stepped in. This zone had already been tested once, and the second tap confirmed demand strength — a key MMC signal.
This dual-tap created a spring effect, launching price upward and rejecting all downside liquidity grabs. It also showed clear absorption of sell-side volume.
📈 3. QFL Behavior + Break of Structure
We see a QFL (Quick Flip Liquidity) reaction just after price bounced from demand — this is a behavior unique to MMC models. Here, price flipped structure rapidly after breaking a local high near 118,500, suggesting aggressive buyer entry.
This QFL event served as the first warning for a major trend shift.
Right after that, we got a major BOS (Break of Structure) above 119,250, further confirming the bullish transition.
🪜 4. Trendline Breakout – Second Confirmation
The descending trendline — connecting several swing highs — was breached with strong bullish momentum. Importantly, this was the second confirmation breakout, not just a fakeout spike.
The breakout candle closed strongly above the trendline and above the SR channel zone (gray area), confirming trend reversal intent.
This aligns with MMC's multi-stage breakout logic, where price gives one trap, pulls back, and then breaks cleanly with intent.
🛡 5. Channel SR Interchange Zone (Support-Resistance Flip)
The gray horizontal SR Channel played a crucial role. Initially acting as resistance, it became support once the breakout was confirmed.
This interchange behavior — a principle where support turns into resistance or vice versa — is critical in MMC. Price flipping this zone and holding above is a strong continuation signal.
🧠 6. Targeting & Forward Outlook
Price is now approaching the Mini Reversal Zone (119,750–120,250). This is a low-timeframe liquidity zone where short-term traders may take profits or where institutional orders may reverse temporarily.
Here are two potential scenarios:
Bullish Continuation: If price pulls back slightly and holds the channel SR as support, we may see a continued leg upward, breaking above 120,250.
Temporary Rejection: A sharp reaction from the Mini Reversal Zone could lead to a retracement into the Central Zone (~118,800), where buyers might reload.
📌 Key MMC Takeaways:
✅ 2x Demand Zone reaction confirmed bullish interest.
✅ QFL + BOS + Trendline Break = High-conviction reversal signal.
✅ SR Flip adds MMC-style structural layering.
✅ Price is now navigating final supply zones before expansion.
👑 Join the Candle King Community
If you find value in these advanced MMC analyses, join the Candle King server — a professional community focused on refining trading journeys through advanced market theory like Mirror Market Concepts, QFL, and real-time price logic.
📢 We don’t just trade levels — we trade behavior.
📊 1. Market Context & Background
The market recently showed a prolonged bearish trendline structure, with lower highs compressing price into a wedge. The prior days have been consolidative, hinting at an accumulation phase. This forms the foundation for reversal setups we often identify in MMC-style analysis — where liquidity, not just structure, determines the next move.
🔍 2. Demand Zone Dominance – 2x Tap Confirmation
At the bottom of the chart, BTC created a strong 2x Demand Zone (117,250–118,000 area), a region where buyers aggressively stepped in. This zone had already been tested once, and the second tap confirmed demand strength — a key MMC signal.
This dual-tap created a spring effect, launching price upward and rejecting all downside liquidity grabs. It also showed clear absorption of sell-side volume.
📈 3. QFL Behavior + Break of Structure
We see a QFL (Quick Flip Liquidity) reaction just after price bounced from demand — this is a behavior unique to MMC models. Here, price flipped structure rapidly after breaking a local high near 118,500, suggesting aggressive buyer entry.
This QFL event served as the first warning for a major trend shift.
Right after that, we got a major BOS (Break of Structure) above 119,250, further confirming the bullish transition.
🪜 4. Trendline Breakout – Second Confirmation
The descending trendline — connecting several swing highs — was breached with strong bullish momentum. Importantly, this was the second confirmation breakout, not just a fakeout spike.
The breakout candle closed strongly above the trendline and above the SR channel zone (gray area), confirming trend reversal intent.
This aligns with MMC's multi-stage breakout logic, where price gives one trap, pulls back, and then breaks cleanly with intent.
🛡 5. Channel SR Interchange Zone (Support-Resistance Flip)
The gray horizontal SR Channel played a crucial role. Initially acting as resistance, it became support once the breakout was confirmed.
This interchange behavior — a principle where support turns into resistance or vice versa — is critical in MMC. Price flipping this zone and holding above is a strong continuation signal.
🧠 6. Targeting & Forward Outlook
Price is now approaching the Mini Reversal Zone (119,750–120,250). This is a low-timeframe liquidity zone where short-term traders may take profits or where institutional orders may reverse temporarily.
Here are two potential scenarios:
Bullish Continuation: If price pulls back slightly and holds the channel SR as support, we may see a continued leg upward, breaking above 120,250.
Temporary Rejection: A sharp reaction from the Mini Reversal Zone could lead to a retracement into the Central Zone (~118,800), where buyers might reload.
📌 Key MMC Takeaways:
✅ 2x Demand Zone reaction confirmed bullish interest.
✅ QFL + BOS + Trendline Break = High-conviction reversal signal.
✅ SR Flip adds MMC-style structural layering.
✅ Price is now navigating final supply zones before expansion.
👑 Join the Candle King Community
If you find value in these advanced MMC analyses, join the Candle King server — a professional community focused on refining trading journeys through advanced market theory like Mirror Market Concepts, QFL, and real-time price logic.
📢 We don’t just trade levels — we trade behavior.
For Daily Trade Setups and Forecast: 📈 t.me/xauusdoptimizer
Premium Signals Fr33: 💯 t.me/xauusdoptimizer
🥰🥳🤩
Premium Signals Fr33: 💯 t.me/xauusdoptimizer
🥰🥳🤩
Related publications
Disclaimer
The information and publications are not meant to be, and do not constitute, financial, investment, trading, or other types of advice or recommendations supplied or endorsed by TradingView. Read more in the Terms of Use.