• The move to $122.5k looks like a sharp liquidity grab / exhaustion wick rather than a sustained follow-through.
• Price failed to hold the top (small bearish candles after the spike) and is now sitting on/near a shallow support area — a classic place for sellers to press once momentum cools.
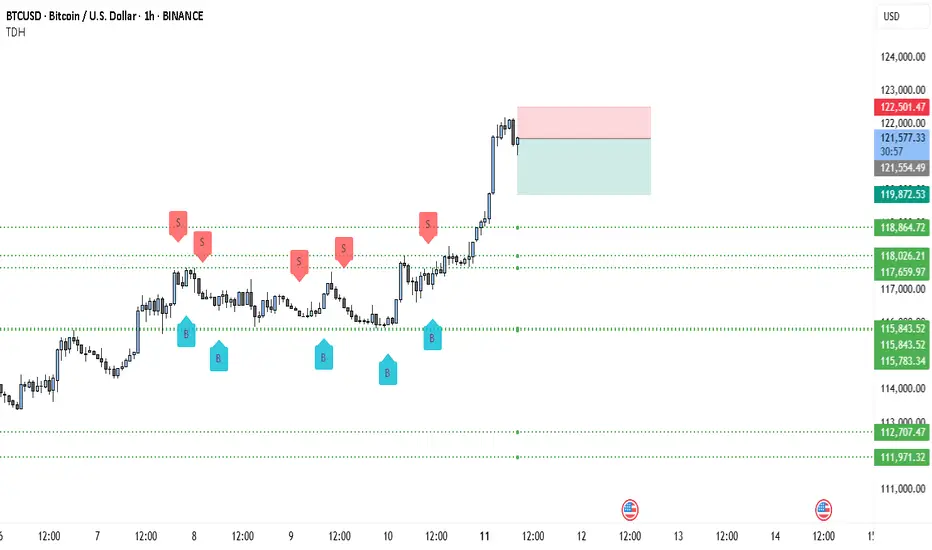
• Multiple prior “S” markers around the mid-$118k zone show persistent supply there; that same supply can re-assert as price retests.
• Bearish bias while price remains below the red supply zone (~$122.2–122.5k) and until it can reclaim & close above ~123k on 1H.
Key levels (read from the chart)
• Immediate resistance / supply zone: 122,200 – 122,501 (red box).
• Current price shown: 121,506.61.
• Support levels (dotted lines): 119,872.53 (first), 118,864.72 (second), 115,843.52 (stronger support / demand).
• Invalidation for the bearish plan: sustained close above ~123,000 (1H close).
Two actionable bearish setups (with exact math)
Setup A — “Rejection short” (preferred)
• Rationale: Wait for a retest/rejection of the red supply zone (122.2–122.5k).
• Entry: 122,200 (short on clear rejection candle)
• Stop: 123,000 (above the supply) → risk = 123,000 − 122,200 = 800 points.
• Targets:
o TP1 = 119,872.53 → reward = 122,200 − 119,872.53 = 2,327.47 → R:R = 2,327.47 / 800 = 2.91 : 1.
o TP2 = 118,864.72 → reward = 122,200 − 118,864.72 = 3,335.28 → R:R ≈ 4.17 : 1.
o TP3 = 115,843.52 → reward = 122,200 − 115,843.52 = 6,356.48 → R:R ≈ 7.95 : 1.
Setup B — “Breakdown short” (if price loses structure)
• Rationale: Trade the structure break — enter only after a clean breakdown below a nearby support retest.
• Entry: 121,000 (short once price decisively breaks and retests lower side)
• Stop: 122,000 → risk = 1,000 points.
• Targets: same support ladder:
o TP1 = 119,872.53 → reward = 121,000 − 119,872.53 = 1,127.47 → R:R = 1,127.47 / 1,000 = 1.13 : 1.
o TP2 = 118,864.72 → R:R ≈ 2.14 : 1.
o TP3 = 115,843.52 → R:R ≈ 5.16 : 1.
Short trade management / rules
• Position sizing: risk a fixed % of account per trade (e.g., 0.5–1%). Use the risk points above to size the position.
• Scaling: take ~25–40% at TP1, move stop to breakeven on first partial fill, trail rest to TP2/TP3.
• Confirmation: prefer one of these confirmations before entry — bearish 1H close below the short entry or clear rejection wick + volume spike to the upside followed by selling. (I can’t see live volume here — check it on your platform.)
• Invalidation: an hourly close above ~123k invalidates the bearish plan; flip bias to neutral/bull.
Why this is a high-probability bearish setup
• The rally was fast and left small-range candles after the spike — typical of exhaustion where liquidity was swept.
• Prior range had repeated sells around lower highs (S markers) — that supply doesn’t vanish; a failed breakout often returns to fill that liquidity.
• The downside targets are relatively close (TP1 is only ~1.63k points below current price, about 1.34%), so short targets are reachable without needing a large trend reversal.
(Example percent math shown exactly: current 121,506.61 − TP1 119,872.53 = 1,634.08 points → 1,634.08 ÷ 121,506.61 = 0.0134485 → ≈ 1.345% drop to TP1.)
Watchouts / final notes
• If BTC prints strong continuation volume on a push above 122.5k and holds >123k on hourly closes, the short edge is gone.
• Check 4H / daily to ensure this isn’t just a higher-timeframe bullish leg that will quickly absorb short pressure. If higher TF shows strong bullish structure, keep stops tighter.
• Not financial advice — treat this as a technical plan and adjust sizing/risk to your rules.
Trade forex, indices, stocks and metals with up to US$100.000 in company's funding.
Complete a challenge to access funding or go for instant deposit.
Trading involves substantial risk. Not financial advice
Complete a challenge to access funding or go for instant deposit.
Trading involves substantial risk. Not financial advice
Related publications
Disclaimer
The information and publications are not meant to be, and do not constitute, financial, investment, trading, or other types of advice or recommendations supplied or endorsed by TradingView. Read more in the Terms of Use.