Bitcoin's daily Bollinger Bands are at one of their tightest levels in history, a pattern that has almost always preceded bullish price action.
Historically, when volatility has compressed to this degree, Bitcoin has followed with strong upward movement.
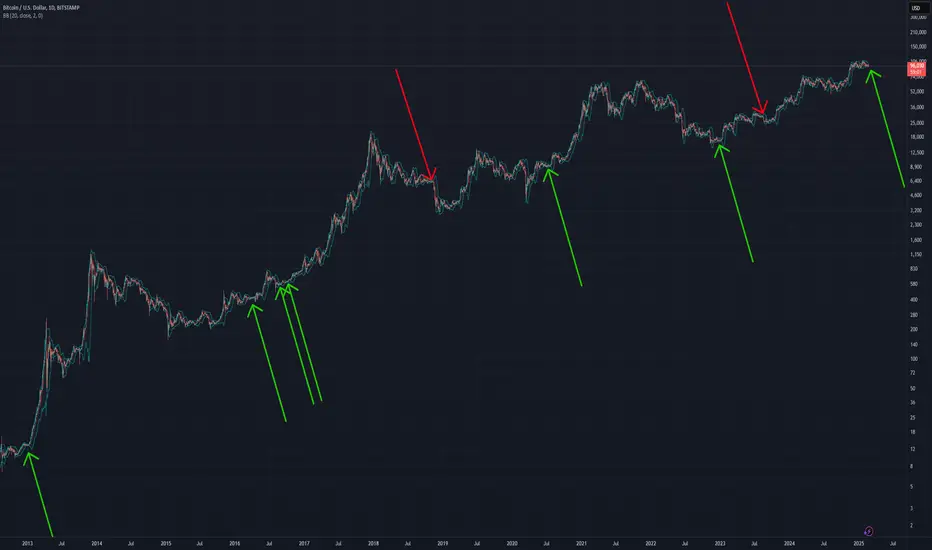
There have only been TWO times in Bitcoins history that the price dropped at these compression levels:
Every other time, a this level of tightness is followed by bullish price action. Given it's history, the odds favour a move higher.
What’s your take — up or down? Will history repeat? Or will this be another rare exception?
Historically, when volatility has compressed to this degree, Bitcoin has followed with strong upward movement.
There have only been TWO times in Bitcoins history that the price dropped at these compression levels:
- November 2018: A sharp drop that took ~6 months to recover.
- August 2023: A decline with a ~2-month recovery.
Every other time, a this level of tightness is followed by bullish price action. Given it's history, the odds favour a move higher.
What’s your take — up or down? Will history repeat? Or will this be another rare exception?
Disclaimer
The information and publications are not meant to be, and do not constitute, financial, investment, trading, or other types of advice or recommendations supplied or endorsed by TradingView. Read more in the Terms of Use.
Disclaimer
The information and publications are not meant to be, and do not constitute, financial, investment, trading, or other types of advice or recommendations supplied or endorsed by TradingView. Read more in the Terms of Use.