The RSI index is in a neutral-to-strong zone but has retreated from earlier levels, indicating that short-term upward momentum has weakened. The MACD indicator still maintains a bullish pattern, though the height of the bars has decreased. The price remains well above both the 50-day and 200-day moving averages, with the medium-to-long-term upward channel intact, keeping the overall structure in a strong bull market. However, there are signs of a potential short-term pullback.👉👉👉
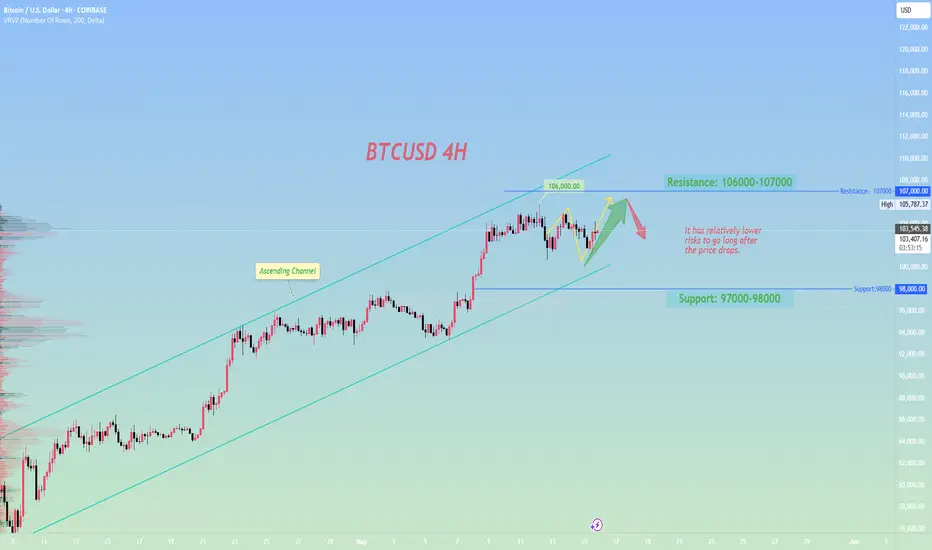
On the daily chart, the Bitcoin price remains above the long-term trend breakout point since April. The 20-day moving average is at $103,260, forming a direct resistance level, while the 50-day moving average at $101,904 coincides with a key support level. As long as the Bitcoin price stays above this dynamic range, bulls still have opportunities.
In view of the current market conditions, short-term trading is recommended for investors to closely monitor the breakthrough of key support and resistance levels. If the price pulls back to the $100,000-$101,000 range and finds support, while forming daily K-line doji or long lower shadow patterns, appropriate position increases can be considered, with targets set at $105,000. After a breakthrough, the target can be further adjusted to $110,000. At the same time, due to market uncertainties and short-term pullback risks, investors should control their position sizes and avoid excessive leverage and blind chasing of gains or panic selling.
BTCUSD Trading Strategy
buy @ 102500-102700
sl 101000
tp 103800-104000
If you think the analysis helpful, you can give a thumbs-up to show your support. If you have different opinions, you can leave your thoughts in the comments. Thank you for reading!👉👉👉
Disclaimer
The information and publications are not meant to be, and do not constitute, financial, investment, trading, or other types of advice or recommendations supplied or endorsed by TradingView. Read more in the Terms of Use.
Disclaimer
The information and publications are not meant to be, and do not constitute, financial, investment, trading, or other types of advice or recommendations supplied or endorsed by TradingView. Read more in the Terms of Use.