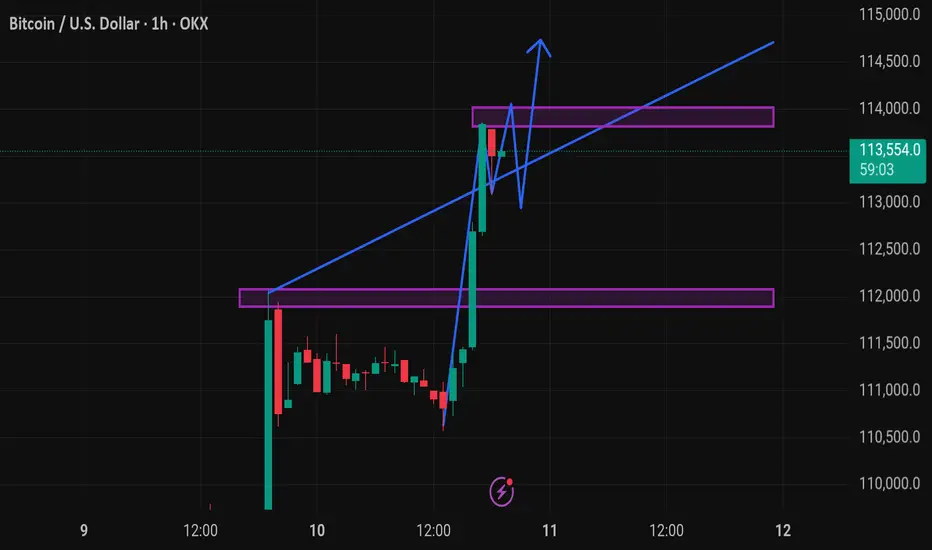
This chart represents the Bitcoin (BTC) / USD price action on a 1-hour timeframe, with technical analysis indicators suggesting a bullish outlook.
Key Elements in the Chart:
1. Current Price:
BTC is trading at $113,506.5, up +1.98% on the 1-hour chart.
2. Support and Resistance Zones:
Support Zone (purple box around ~$112,000): Recently tested and held, now acting as a potential base.
Resistance Zone (purple box around ~$113,800 to ~$114,000): Price is currently consolidating just below this zone.
3. Trendline:
A rising blue trendline is acting as dynamic support, showing upward momentum.
4. Projected Price Action (Blue Arrow Path):
The blue path suggests a potential bullish breakout from the resistance zone.
Implies consolidation, retest of support/trendline, and continuation upward—a common bullish flag or pennant pattern.
---
Interpretation:
The chart setup is bullish, expecting:
Retest of support near $113,200–$113,400
Break above the $114,000 resistance
Potential rally continuation beyond $114,000 (toward $115,000 or more)
Caution:
If BTC fails to hold the trendline or drops below the support zone (~$112,000), this bullish setup may be invalidated.
Would you like a trading strategy (e.g., entry/exit levels or risk management) based on this setup?
🎯XAUUSD GOLD Daily 8-9 Free Signals🚀 World Best community Join Here ✅
💫XAUUSD
💫BTC
💫EURUSD
For Signals Telegram channel
⬇️⬇️⬇️⬇️⬇️⬇️⬇️⬇️⬇️⬇️⬇️⬇️⬇️
t.me/technicaltrader10
💫XAUUSD
💫BTC
💫EURUSD
For Signals Telegram channel
⬇️⬇️⬇️⬇️⬇️⬇️⬇️⬇️⬇️⬇️⬇️⬇️⬇️
t.me/technicaltrader10
Disclaimer
The information and publications are not meant to be, and do not constitute, financial, investment, trading, or other types of advice or recommendations supplied or endorsed by TradingView. Read more in the Terms of Use.