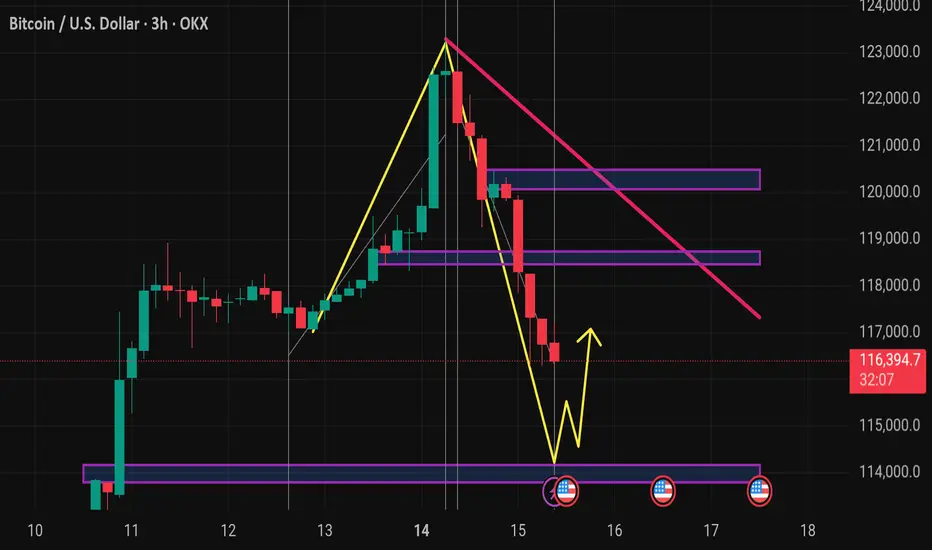
This chart displays the Bitcoin (BTC/USD) 3-hour price action with several technical indicators and patterns annotated. Here's a breakdown of what it shows:
Key Observations:
1. Price Action:
BTC is currently priced around $116,386, showing a -2.93% drop.
A strong downtrend has formed after a significant upward move, possibly forming a bearish ABCD pattern.
2. Harmonic Pattern:
The chart appears to reflect a completed harmonic retracement, with a deep retracement (near 0.88 Fibonacci level).
This suggests a potential reversal or bounce zone.
3. Support & Resistance Zones:
Several purple horizontal boxes indicate key support and resistance zones.
The current price is approaching a major support zone near $114,000–$115,000, which has been tested previously (visible on the left side).
4. Trend Lines:
A pink downward trend line suggests ongoing bearish momentum.
Price may need to break above this line to confirm a reversal.
5. Yellow Zig-Zag Path:
Indicates a possible bullish reversal scenario, predicting a bounce off the lower support zone followed by a move upward.
6. Event Markers:
Red circular icons (with flags) near the support zone hint at upcoming fundamental news/events that may influence price action.
---
Interpretation:
Short-term bias: Bearish until strong support holds (~$114,000–$115,000).
Possible trade setup: Watch for bullish reversal signals at support (candlestick patterns, RSI divergence, etc.) before entering long.
**Risk
🎯XAUUSD GOLD Daily 8-9 Free Signals🚀 World Best community Join Here ✅
💫XAUUSD
💫BTC
💫EURUSD
For Signals Telegram channel
⬇️⬇️⬇️⬇️⬇️⬇️⬇️⬇️⬇️⬇️⬇️⬇️⬇️
t.me/technicaltrader10
💫XAUUSD
💫BTC
💫EURUSD
For Signals Telegram channel
⬇️⬇️⬇️⬇️⬇️⬇️⬇️⬇️⬇️⬇️⬇️⬇️⬇️
t.me/technicaltrader10
Disclaimer
The information and publications are not meant to be, and do not constitute, financial, investment, trading, or other types of advice or recommendations supplied or endorsed by TradingView. Read more in the Terms of Use.