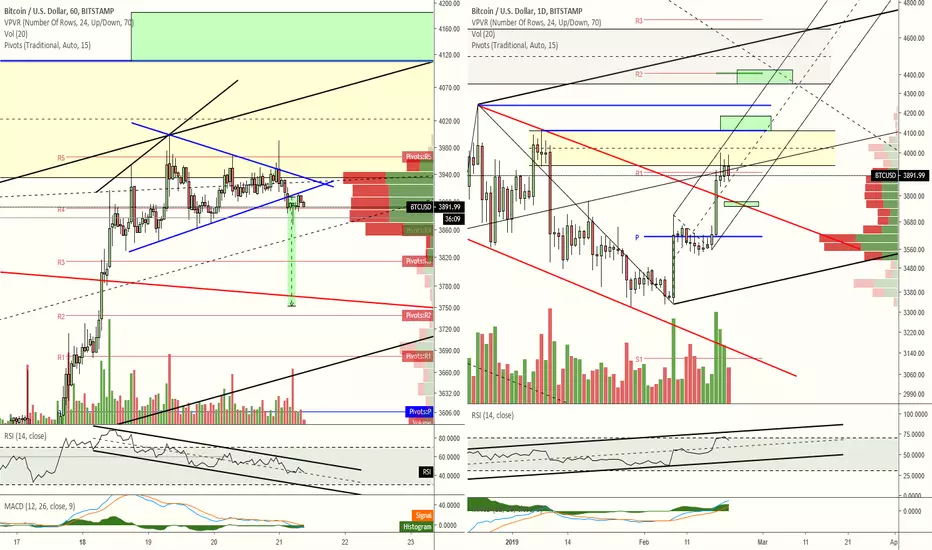
Good morning, traders. Price has finally dropped below support and should be heading toward the lower target now. The measured move off that triangle/ascending broadening wedge breakdown is $3750 which is also the 38% retracement of the February 7th move up. As mentioned the past couple of days, that general area should give price a retest of the 2.5 month old descending channel's resistance as support. If price successfully retests resistance as support then, depending on how fast price moves down now, it will most likely to find support around $3750-$3770 with a possible wick down to the H2 R2 pivot at $3740. VPVR suggests that a push beyond these levels should have price targeting the D1 pivot.
H1 RSI is bearish at 45, suggesting further downward price movement. Traders should be watching for a breach of the descending channel that H1 RSI is currently printing to suggest that price is likely regaining upward momentum. We also cannot discount the possibility of price ranging between $3815 and $3966 (H1 R3 and R5 pivots, respectively), similar to what happened between February 8th and February 17th. The daily chart shows price hovering around the R1 pivot and median of the large Modified Schiff Pitchfork, just below supply. It also shows price ranging in the top half of the more recent Modified Schiff Pitchfork. D1 RSI is just below overbought and within the upper half of its ascending channel.
A break below $3500 suggests a larger move downward. However, a close below the daily pivot at $3615 would have me already preparing for that larger move. As bullish as things look at this time, traders should not allow emotion to cloud their views. Always trade the charts, not what you want the charts to say.
Every day, we have a choice to act positively or negatively, so if you get a chance, do something decent for someone today which could be as simple as sharing a nice word with them. You just might change their day, or even their life.
Remember, you can always click on the "share" button in the lower right hand of the screen, under the chart, and then click on "Make it mine" from the popup menu in order to get a live version of the chart that you can explore on your own.
Disclaimer
The information and publications are not meant to be, and do not constitute, financial, investment, trading, or other types of advice or recommendations supplied or endorsed by TradingView. Read more in the Terms of Use.
Disclaimer
The information and publications are not meant to be, and do not constitute, financial, investment, trading, or other types of advice or recommendations supplied or endorsed by TradingView. Read more in the Terms of Use.