Hi,
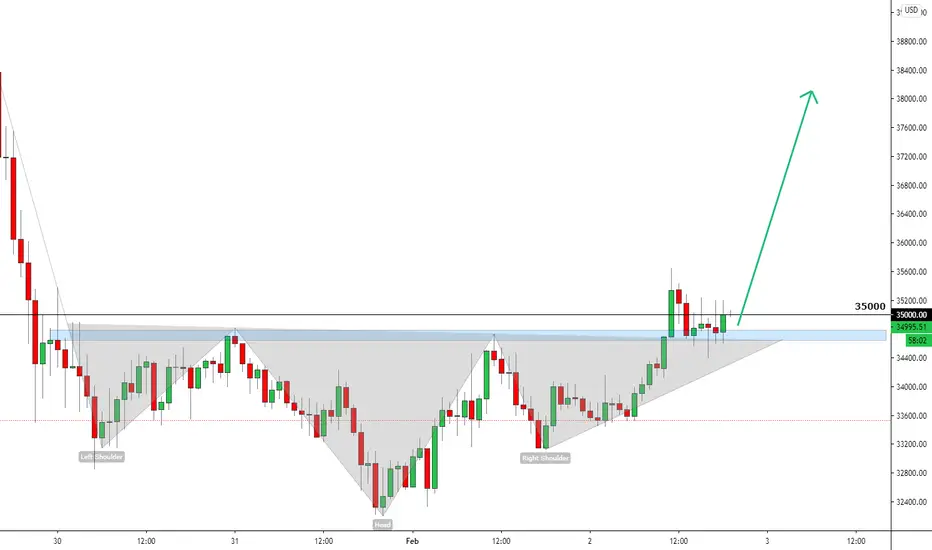
1. We have a bullish chart pattern called Inverted Head and Shoulders (IHS)
2. The pattern is activated because we have a break and close above the neckline (above the gray area)
3. The price got rejection after the neckline retest
4. The price of BTC got a close above the strong area 34-35k
So, everything should be ready to climb higher - technically :)
Regards,
Vaido
🔍I do the technicals - so You don’t have to.
📊Follow my research on Substack:
👉vaido.substack.com/ - ENG
👉vaidoveek.substack.com/ - EST
🚀 Actionable market analysis, ideas, and education
📊Follow my research on Substack:
👉vaido.substack.com/ - ENG
👉vaidoveek.substack.com/ - EST
🚀 Actionable market analysis, ideas, and education
Disclaimer
The information and publications are not meant to be, and do not constitute, financial, investment, trading, or other types of advice or recommendations supplied or endorsed by TradingView. Read more in the Terms of Use.