Dear all,
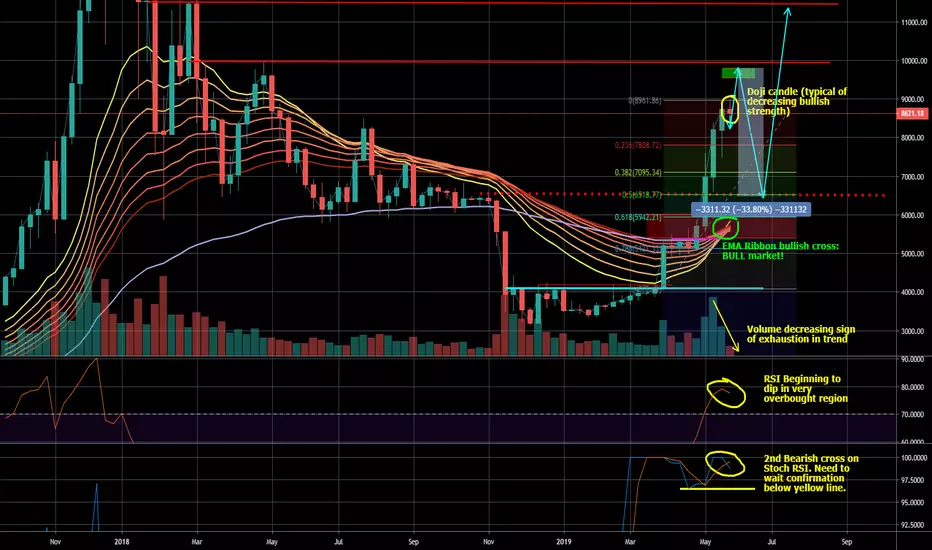
Enjoy this chart. All details are in the chart, showcasing the confluence of bearish indicators for the 33% correction within this BULL market.
In summary:
1- One final push to the upside (9.8-10k levels) this week
2- 33% correction to the 50% fib in June
3- rip to $11.5k in July/August, after the RSI and Stoch RSI have cooled off to oversold regions
Projected price action is in light blue on the chart.
Cheers,
Leb Crypto
Disclaimer
The information and publications are not meant to be, and do not constitute, financial, investment, trading, or other types of advice or recommendations supplied or endorsed by TradingView. Read more in the Terms of Use.
Disclaimer
The information and publications are not meant to be, and do not constitute, financial, investment, trading, or other types of advice or recommendations supplied or endorsed by TradingView. Read more in the Terms of Use.