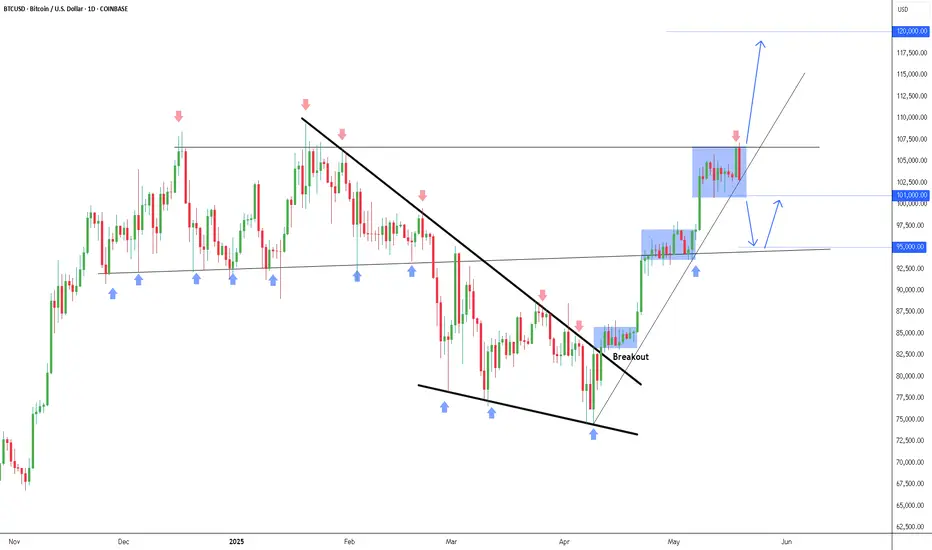
BTCUSD daily chart shows price action respecting a rising trendline, following a successful breakout from previous pattern. This ascending trendline now acts as a key dynamic support and serves as a central guide for the medium-term bullish structure.
Currently, price is consolidating just below the $107,000 resistance area. There are two primary scenarios to consider:
Bullish Scenario:
A confirmed breakout and daily close above the $107,000 resistance could trigger another bullish leg, targeting the next level near $120,000.
Mild Bearish / Pullback Scenario:
If the price gets rejected again, it may retrace towards the ascending trendline around $95,000, which aligns with previous horizontal support and could serve as a solid buy-the-dip zone.
Trade Plan:
- Buy Entry Option 1: On a breakout above $107,000 → Target: $120,000
- Buy Entry Option 2: On a bounce from the trendline near $95,000
Disclaimer
The information and publications are not meant to be, and do not constitute, financial, investment, trading, or other types of advice or recommendations supplied or endorsed by TradingView. Read more in the Terms of Use.
Disclaimer
The information and publications are not meant to be, and do not constitute, financial, investment, trading, or other types of advice or recommendations supplied or endorsed by TradingView. Read more in the Terms of Use.