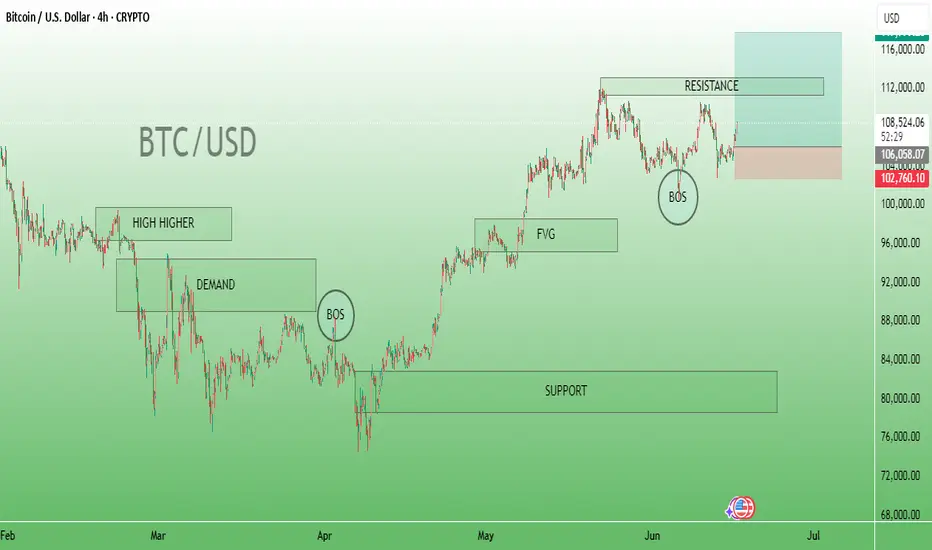
Price Action: The market is in a downward correction after hitting a resistance area.
---
📊 Key Marked Zones and Concepts
1. High Higher (Left Side):
Indicates previous higher high formed in an uptrend structure.
2. Demand Zone (Below High):
Area where buyers previously stepped in strongly.
Likely a bullish order block or accumulation zone.
3. BOS (Break of Structure):
Two BOS points are marked, confirming market structure breaks:
Left BOS: Marks transition from uptrend to a possible downtrend.
Right BOS: Confirms shift again or continuation of downward correction.
4. FVG (Fair Value Gap):
Indicates an imbalance in price action.
Price may revisit this zone to "fill the gap."
5. Resistance (Top Right):
Price reached this level and is rejecting downward.
Could be a short-entry zone, as indicated by the red-to-green risk box (risk-to-reward trade setup).
6. Support (Bottom):
A larger green support block exists far below current price (~$91,000–$82,000).
Possibly a target area for longer-term bears.
---
🎯 Trade Setup Visible
Short Position Active:
Entry near resistance zone (~108K–110K).
Stop-loss above resistance (~115K).
Take-profit near $102,760 or lower, aligned with BOS and demand area.
---
🧠 Interpretation
This analysis shows that:
The trader expects BTC to drop from the resistance zone.
The bearish BOS and FVG support a retracement or reversal.
Targeting a deeper correction toward support or earlier demand zones.
---
📊 Key Marked Zones and Concepts
1. High Higher (Left Side):
Indicates previous higher high formed in an uptrend structure.
2. Demand Zone (Below High):
Area where buyers previously stepped in strongly.
Likely a bullish order block or accumulation zone.
3. BOS (Break of Structure):
Two BOS points are marked, confirming market structure breaks:
Left BOS: Marks transition from uptrend to a possible downtrend.
Right BOS: Confirms shift again or continuation of downward correction.
4. FVG (Fair Value Gap):
Indicates an imbalance in price action.
Price may revisit this zone to "fill the gap."
5. Resistance (Top Right):
Price reached this level and is rejecting downward.
Could be a short-entry zone, as indicated by the red-to-green risk box (risk-to-reward trade setup).
6. Support (Bottom):
A larger green support block exists far below current price (~$91,000–$82,000).
Possibly a target area for longer-term bears.
---
🎯 Trade Setup Visible
Short Position Active:
Entry near resistance zone (~108K–110K).
Stop-loss above resistance (~115K).
Take-profit near $102,760 or lower, aligned with BOS and demand area.
---
🧠 Interpretation
This analysis shows that:
The trader expects BTC to drop from the resistance zone.
The bearish BOS and FVG support a retracement or reversal.
Targeting a deeper correction toward support or earlier demand zones.
Free Accurate GOLD Signals Quality Education 🎓Quality Analysis 🔥🔥High Impact News Livetrades Accuracy 💯💯 All FREE!
Disclaimer
The information and publications are not meant to be, and do not constitute, financial, investment, trading, or other types of advice or recommendations supplied or endorsed by TradingView. Read more in the Terms of Use.