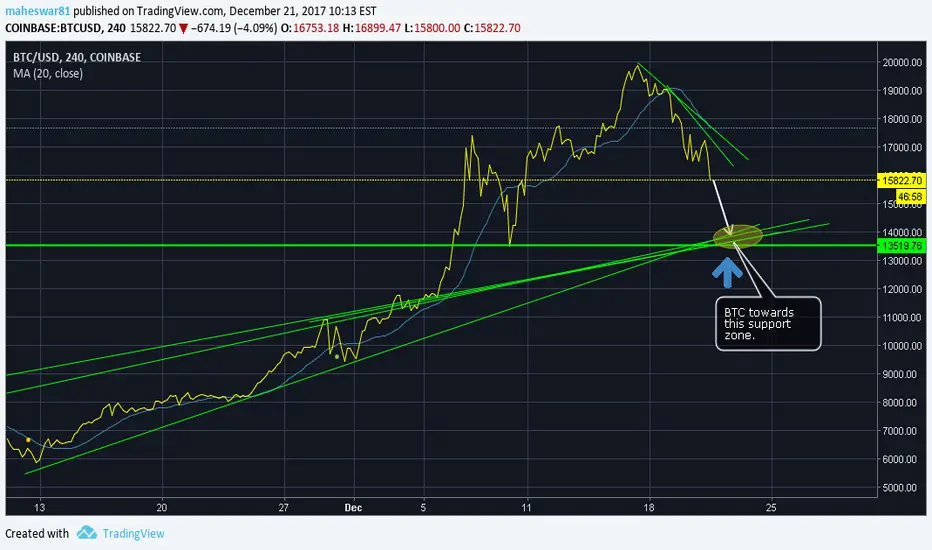
I have drawn a chart where BTC can take support
Note
14300 now, 800 more to reach the target.Note
As our chart is based on Line and price close, support was nicely held last time.I observe 2 things :
1) Price is testing the support again and again to check the strength.
2) As the fall was very steep, it will breakout soon. A breakout will change the sentiment towards positive.
Note
As our chart is based on Line and price close, we dnot consider the price extension in that particular timeframe. Price closed well above the support and bounced back.
Note
Well, I dnot know how to change the heading. BTC heading to 20000? should be the title.
Note
My view on the BTC/USDNote
Look at the RSI, it is at the Oversold condition which can take the price to the upside.Note
Update :A decent bounce from the demand zone
Note
We broke the roof top pattern and formed a downtrend channel. Price is following into the channel. But there is a strong support at the demand zone. As long as support holds the demand zone, we can buy there and sell on top. 1) Price on trendline
2) Forming a symmetric triangle pattern which can breakout soon.
3) Price is above the support.
Related publications
Disclaimer
The information and publications are not meant to be, and do not constitute, financial, investment, trading, or other types of advice or recommendations supplied or endorsed by TradingView. Read more in the Terms of Use.
Related publications
Disclaimer
The information and publications are not meant to be, and do not constitute, financial, investment, trading, or other types of advice or recommendations supplied or endorsed by TradingView. Read more in the Terms of Use.