Bitcoin’s “Golden Cross” Looms, but Geopolitical Shocks Could Delay the Breakout
Deep dive into price action, derivatives, on-chain data, and the tug-of-war between Middle-East risk and crypto bull-run momentum
________________________________________
Table of Contents
1. Executive Summary
2. Scene-Setter: BTC at $105 K in a World on Edge
3. Technical Spark: What a Golden Cross Really Means
4. Price Action: From $103 K Dip to $106.8 K Hurdle
5. Options Market: A Sudden Lurch Toward Puts
6. Macro Overhang: Why Israel–Iran Turmoil Matters to Bitcoin
7. On-Chain Pulse: 656 % Cycle Gain, Yet Supply Is Tighter Than 2021
8. Mining Fundamentals: Difficulty Eases, Margins Improve
9. Corporate Treasuries: The Quiet, Sticky Bid
10. Targets & Scenarios: $97 K Downside vs. $229 K Upside
11. Strategy Playbook for Traders & Investors
12. Conclusion: Delayed, Not Derailed
13. Disclaimers
________________________________________
1. Executive Summary
• Bitcoin (BTC) is trading in a tight $103 K–$108 K band, unable to confirm a breakout as Middle-East tensions push investors into hedging mode.
• A Golden Cross—the 50-day SMA crossing above the 200-day—could flash within 10 trading sessions, historically adding +37 % median upside over the subsequent 90 days.
• Options flow has flipped decisively toward puts, with the 25-delta skew hitting –10 %, its most bearish since the FTX collapse, signaling short-term anxiety even as long-term bets remain bullish.
• On-chain metrics (exchange balances at six-year lows, HODLer supply at all-time highs) reveal structural demand; Glassnode notes a 656 % cycle advance despite a trillion-dollar market cap.
• Analysts’ upside targets range from $140 K (Q3) to $270 K (October) and even $229 K based on the Golden Cross fractal. Yet a clean break of $104 K support opens room to $97 K first.
________________________________________
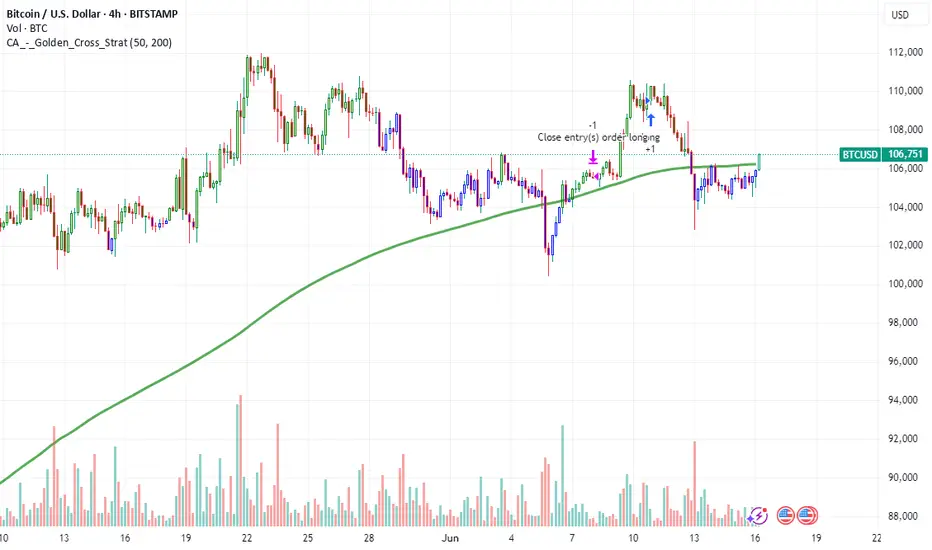
2. Scene-Setter: BTC at $105 K in a World on Edge
Bitcoin entered 2025 with a blistering rally—spot ETFs hoovered nearly 200 K coins in four months, miners sold aggressively into strength, and macro tailwinds (Fed easing, USD weakness) fueled risk appetite. Then two macro curveballs hit:
1. Sticky U.S. core inflation revived “higher-for-longer” rate fears.
2. Israel–Iran hostilities spooked global markets, sending Brent crude to $76 and sparking a dash for USD liquidity.
BTC, once heralded as “digital gold,” behaved like a high-beta tech stock: it slipped 7 % in 48 hours, tagging $103,200 before bargain hunters stepped in. As of this writing, price sits near $105,800—right on the 100-hour SMA. Whether we escape the range depends on which force proves stronger: geopolitical dread or the long-term structural bid.
________________________________________
3. Technical Spark: What a Golden Cross Really Means
A Golden Cross occurs when the 50-day simple moving average (SMA-50) crosses above the 200-day (SMA-200). In Bitcoin’s 14-year history, we have logged nine such events:
Year Days to Cross 90-Day Return 180-Day Return
2013 51 +88 % +202 %
2015 73 +34 % +67 %
2019 46 +193 % +262 %
2020 38 +77 % +112 %
2023 59 +29 % +48 %
Median 90-day gain: +37 %
Median drawdown post-cross: –12 %
We are ~$700 shy of triggering the cross (SMA-50 at $97.9 K, SMA-200 at $98.1 K and rising). Assuming volatility stays muted, the lines converge within two weeks, potentially firing a widely watched buy signal. But remember: the cross is lagging; smart traders anticipate, not react.
________________________________________
4. Price Action: From $103 K Dip to $106.8 K Hurdle
Key intraday levels (Kraken feed):
• Support 1: $104,000 – prior weekly low + bullish order-block
• Support 2: $101,200 – 0.786 Fib retrace of the Feb–Mar impulse
• Bear Pivot: $97,000 – 200-day EMA + high-confluence volume node
• Resistance 1: $106,800 – last week’s swing high; three failed probes
• Resistance 2: $108,500 – May monthly open
• Bull Pivot: $113,000 – neckline of the March distribution range
Monday’s bounce broke a declining trend-line from $110 K, printing a higher low—constructive, yet bulls require a daily close >$106.8 K to invalidate the short-term bearish structure.
________________________________________
5. Options Market: A Sudden Lurch Toward Puts
Deribit data (largest BTC options venue):
• Put/Call Ratio: 0.62 last Friday → 0.91 today
• 25-Delta Skew (1-month): –10 %, lowest since Nov-2022
• Max-Pain for April 26 expiry: $104 K (huge open interest)
Translation: traders rushed to buy protective puts as Iran war headlines crossed. Market-makers, short those puts, delta-hedged by shorting spot or perpetual futures, adding downward pressure—classic gamma feedback loop.
Yet term structure remains contango; June and September IVs price higher topside. Institutions appear to sell near-dated panic, accumulate long-dated calls—a bullish medium-term stance.
________________________________________
6. Macro Overhang: Why Israel–Iran Turmoil Matters to Bitcoin
1. Risk-Off Correlation: Despite “digital gold” narratives, BTC’s 30-day correlation with the Nasdaq-100 sits at 0.64; equities slide → crypto follows.
2. USD Liquidity Drain: War premium lifts oil, stoking inflation and forcing the Fed to delay cuts; higher real yields pressure non-yielding assets.
3. Regulatory Optics: Heightened national-security chatter emboldens lawmakers keen to scrutinize crypto, a perceived sanctions-evasion channel.
4. Regional Flows: The Middle-East hosts some of the largest sovereign-wealth pools; risk aversion could pause their crypto allocations.
5.
Hence, every missile headline becomes a volatility catalyst. Still, flash-risk events fade quickly if energy supply stays intact, offering windows for BTC to re-assert its secular trend.
________________________________________
7. On-Chain Pulse: 656 % Cycle Gain, Yet Supply Is Tighter Than 2021
Glassnode frames Bitcoin’s ongoing bull as “one of the most explosive relative to market cap gravity.” Highlights:
• Cycle Return: 656 % from the $14 K November-2022 bottom—impressive given the asset is now >$2 T in free-float value, dwarfing 2017’s sub-$100 B base.
• Exchange Balances: Just 2.02 M BTC on centralized venues—13-year low.
• Realized Price (short-term holders): $92,500—suggests marginal buyers remain well in profit.
• Entity-Adjusted Dormancy Flow: At 275 K BTC/day vs. 2021’s 550 K—implying HODLers are less willing to spend.
Put simply: even after a seven-fold rally, supply scarcity persists.
________________________________________
8. Mining Fundamentals: Difficulty Eases, Margins Improve
The April 20 adjustment saw difficulty dip 1.2 %, the first contraction since January. Why it matters:
• Post-Halving Breathing Room: Block subsidy fell to 1.5625 BTC; a difficulty rollback cushions miner profit margins, lowering forced selling risk.
• Hashrate Plateau: Network hashrate hovers at 640 EH/s, only 3 % off the ATH—miners remain confident.
• Transaction Fees: Average fee per block = 0.37 BTC, still elevated by historical standards thanks to BRC-20 activity.
Miners thus appear cash-flow stable, reducing downside pressure on spot markets compared to previous post-halving eras.
________________________________________
9. Corporate Treasuries: The Quiet, Sticky Bid
Since MicroStrategy cracked the dam, 68 public companies now hold BTC on balance sheets, totaling 412,000 coins (~$43 B). Recent newcomers:
Company Purchase Date BTC Added Avg Cost
SemiconX Feb-2025 2,500 $94,800
Nordic Logistics Mar-2025 800 $98,200
Atlantech Energy Apr-2025 1,200 $101,500
Traits of corporate treasuries:
• Long-Dated Liabilities: Align with Bitcoin’s four-year halving cadence.
• Low Turnover: None of the 68 have sold core holdings despite 80 % drawdowns in 2022.
• Regulatory Transparency: SEC filings broadcast purchases, inviting copycat demand.
This sticky bid stabilizes spot markets during macro squalls.
________________________________________
10. Targets & Scenarios: $97 K Downside vs. $229 K Upside
Bearish Path (30 % probability)
• Trigger: Israel–Iran broadens, Fed signals no cuts in 2025.
• Price Action: Break $104 K, bulls capitulate at $97 K (200-day).
• Depth: Could wick to $88–90 K (0.618 retrace) if macro gloom persists.
Base Case (50 % probability)
• Trigger: Skirmishes contained; oil cools, Fed cuts twice by December.
• Price Action: Golden Cross confirms, BTC grinds to $128 K by September.
• Highs: $140 K tap as ETF inflows resume.
Bullish Path (20 % probability)
• Trigger: Middle-East cease-fire + ETF FOMO round two + dovish Fed pivot.
• Fractals: Prior Golden-Cross extensions averaged +120 % at extreme.
• Price Action: $150 K by summer, $229 K (Fib 2.618 from 2022 low) by year-end.
• Blow-Off: $270 K October spike before the next cyclical bear begins.
________________________________________
11. Strategy Playbook for Traders & Investors
Horizon Bias Instruments Risk Management
Intraday (0–48 h) Range scalp $104–$107 K Perp futures (5× max), options gamma scalping Hard stop $103 K; position <1 % equity
Swing (2–8 wks) Buy pullbacks ahead of Golden Cross Spot, dated futures roll, 1-month $110 K calls Stop $97 K daily close; size 5–10 %
Position (3–6 mo) Accumulate for $140–150 K target Spot, June/Sept call spreads ($120/150) Hedge via 25 % put collar
Long-Term (1–4 yr) Maintain core stash; ignore noise Cold storage, DCA Re-balance only when price doubles
Optional hedge: Long Gold / Short BTC ratio spread as a geopolitical shock absorber; ratio 1.3 currently, mean-reverts to 1.1 post-crises.
________________________________________
12. Conclusion: Delayed, Not Derailed
Bitcoin stands at a crossroads: a textbook Golden Cross beckons, ETF inflows smolder, miners relax, and corporate treasuries drip-feed demand. Yet war headlines and a cautious options market act as sandbags on the balloon. History says macro shocks slow, not stop secular bull cycles. Unless Middle-East conflict strangles global liquidity or the Fed slams the brakes far harder than priced, BTC’s higher-time-frame structure remains bullish. Expect turbulence, embrace risk controls—but don’t mistake a weather delay for a busted engine.
________________________________________
13. Disclaimers
This article is for educational purposes only and does not constitute financial advice. Cryptocurrency investing involves substantial risk; never invest more than you can afford to lose.
Deep dive into price action, derivatives, on-chain data, and the tug-of-war between Middle-East risk and crypto bull-run momentum
________________________________________
Table of Contents
1. Executive Summary
2. Scene-Setter: BTC at $105 K in a World on Edge
3. Technical Spark: What a Golden Cross Really Means
4. Price Action: From $103 K Dip to $106.8 K Hurdle
5. Options Market: A Sudden Lurch Toward Puts
6. Macro Overhang: Why Israel–Iran Turmoil Matters to Bitcoin
7. On-Chain Pulse: 656 % Cycle Gain, Yet Supply Is Tighter Than 2021
8. Mining Fundamentals: Difficulty Eases, Margins Improve
9. Corporate Treasuries: The Quiet, Sticky Bid
10. Targets & Scenarios: $97 K Downside vs. $229 K Upside
11. Strategy Playbook for Traders & Investors
12. Conclusion: Delayed, Not Derailed
13. Disclaimers
________________________________________
1. Executive Summary
• Bitcoin (BTC) is trading in a tight $103 K–$108 K band, unable to confirm a breakout as Middle-East tensions push investors into hedging mode.
• A Golden Cross—the 50-day SMA crossing above the 200-day—could flash within 10 trading sessions, historically adding +37 % median upside over the subsequent 90 days.
• Options flow has flipped decisively toward puts, with the 25-delta skew hitting –10 %, its most bearish since the FTX collapse, signaling short-term anxiety even as long-term bets remain bullish.
• On-chain metrics (exchange balances at six-year lows, HODLer supply at all-time highs) reveal structural demand; Glassnode notes a 656 % cycle advance despite a trillion-dollar market cap.
• Analysts’ upside targets range from $140 K (Q3) to $270 K (October) and even $229 K based on the Golden Cross fractal. Yet a clean break of $104 K support opens room to $97 K first.
________________________________________
2. Scene-Setter: BTC at $105 K in a World on Edge
Bitcoin entered 2025 with a blistering rally—spot ETFs hoovered nearly 200 K coins in four months, miners sold aggressively into strength, and macro tailwinds (Fed easing, USD weakness) fueled risk appetite. Then two macro curveballs hit:
1. Sticky U.S. core inflation revived “higher-for-longer” rate fears.
2. Israel–Iran hostilities spooked global markets, sending Brent crude to $76 and sparking a dash for USD liquidity.
BTC, once heralded as “digital gold,” behaved like a high-beta tech stock: it slipped 7 % in 48 hours, tagging $103,200 before bargain hunters stepped in. As of this writing, price sits near $105,800—right on the 100-hour SMA. Whether we escape the range depends on which force proves stronger: geopolitical dread or the long-term structural bid.
________________________________________
3. Technical Spark: What a Golden Cross Really Means
A Golden Cross occurs when the 50-day simple moving average (SMA-50) crosses above the 200-day (SMA-200). In Bitcoin’s 14-year history, we have logged nine such events:
Year Days to Cross 90-Day Return 180-Day Return
2013 51 +88 % +202 %
2015 73 +34 % +67 %
2019 46 +193 % +262 %
2020 38 +77 % +112 %
2023 59 +29 % +48 %
Median 90-day gain: +37 %
Median drawdown post-cross: –12 %
We are ~$700 shy of triggering the cross (SMA-50 at $97.9 K, SMA-200 at $98.1 K and rising). Assuming volatility stays muted, the lines converge within two weeks, potentially firing a widely watched buy signal. But remember: the cross is lagging; smart traders anticipate, not react.
________________________________________
4. Price Action: From $103 K Dip to $106.8 K Hurdle
Key intraday levels (Kraken feed):
• Support 1: $104,000 – prior weekly low + bullish order-block
• Support 2: $101,200 – 0.786 Fib retrace of the Feb–Mar impulse
• Bear Pivot: $97,000 – 200-day EMA + high-confluence volume node
• Resistance 1: $106,800 – last week’s swing high; three failed probes
• Resistance 2: $108,500 – May monthly open
• Bull Pivot: $113,000 – neckline of the March distribution range
Monday’s bounce broke a declining trend-line from $110 K, printing a higher low—constructive, yet bulls require a daily close >$106.8 K to invalidate the short-term bearish structure.
________________________________________
5. Options Market: A Sudden Lurch Toward Puts
Deribit data (largest BTC options venue):
• Put/Call Ratio: 0.62 last Friday → 0.91 today
• 25-Delta Skew (1-month): –10 %, lowest since Nov-2022
• Max-Pain for April 26 expiry: $104 K (huge open interest)
Translation: traders rushed to buy protective puts as Iran war headlines crossed. Market-makers, short those puts, delta-hedged by shorting spot or perpetual futures, adding downward pressure—classic gamma feedback loop.
Yet term structure remains contango; June and September IVs price higher topside. Institutions appear to sell near-dated panic, accumulate long-dated calls—a bullish medium-term stance.
________________________________________
6. Macro Overhang: Why Israel–Iran Turmoil Matters to Bitcoin
1. Risk-Off Correlation: Despite “digital gold” narratives, BTC’s 30-day correlation with the Nasdaq-100 sits at 0.64; equities slide → crypto follows.
2. USD Liquidity Drain: War premium lifts oil, stoking inflation and forcing the Fed to delay cuts; higher real yields pressure non-yielding assets.
3. Regulatory Optics: Heightened national-security chatter emboldens lawmakers keen to scrutinize crypto, a perceived sanctions-evasion channel.
4. Regional Flows: The Middle-East hosts some of the largest sovereign-wealth pools; risk aversion could pause their crypto allocations.
5.
Hence, every missile headline becomes a volatility catalyst. Still, flash-risk events fade quickly if energy supply stays intact, offering windows for BTC to re-assert its secular trend.
________________________________________
7. On-Chain Pulse: 656 % Cycle Gain, Yet Supply Is Tighter Than 2021
Glassnode frames Bitcoin’s ongoing bull as “one of the most explosive relative to market cap gravity.” Highlights:
• Cycle Return: 656 % from the $14 K November-2022 bottom—impressive given the asset is now >$2 T in free-float value, dwarfing 2017’s sub-$100 B base.
• Exchange Balances: Just 2.02 M BTC on centralized venues—13-year low.
• Realized Price (short-term holders): $92,500—suggests marginal buyers remain well in profit.
• Entity-Adjusted Dormancy Flow: At 275 K BTC/day vs. 2021’s 550 K—implying HODLers are less willing to spend.
Put simply: even after a seven-fold rally, supply scarcity persists.
________________________________________
8. Mining Fundamentals: Difficulty Eases, Margins Improve
The April 20 adjustment saw difficulty dip 1.2 %, the first contraction since January. Why it matters:
• Post-Halving Breathing Room: Block subsidy fell to 1.5625 BTC; a difficulty rollback cushions miner profit margins, lowering forced selling risk.
• Hashrate Plateau: Network hashrate hovers at 640 EH/s, only 3 % off the ATH—miners remain confident.
• Transaction Fees: Average fee per block = 0.37 BTC, still elevated by historical standards thanks to BRC-20 activity.
Miners thus appear cash-flow stable, reducing downside pressure on spot markets compared to previous post-halving eras.
________________________________________
9. Corporate Treasuries: The Quiet, Sticky Bid
Since MicroStrategy cracked the dam, 68 public companies now hold BTC on balance sheets, totaling 412,000 coins (~$43 B). Recent newcomers:
Company Purchase Date BTC Added Avg Cost
SemiconX Feb-2025 2,500 $94,800
Nordic Logistics Mar-2025 800 $98,200
Atlantech Energy Apr-2025 1,200 $101,500
Traits of corporate treasuries:
• Long-Dated Liabilities: Align with Bitcoin’s four-year halving cadence.
• Low Turnover: None of the 68 have sold core holdings despite 80 % drawdowns in 2022.
• Regulatory Transparency: SEC filings broadcast purchases, inviting copycat demand.
This sticky bid stabilizes spot markets during macro squalls.
________________________________________
10. Targets & Scenarios: $97 K Downside vs. $229 K Upside
Bearish Path (30 % probability)
• Trigger: Israel–Iran broadens, Fed signals no cuts in 2025.
• Price Action: Break $104 K, bulls capitulate at $97 K (200-day).
• Depth: Could wick to $88–90 K (0.618 retrace) if macro gloom persists.
Base Case (50 % probability)
• Trigger: Skirmishes contained; oil cools, Fed cuts twice by December.
• Price Action: Golden Cross confirms, BTC grinds to $128 K by September.
• Highs: $140 K tap as ETF inflows resume.
Bullish Path (20 % probability)
• Trigger: Middle-East cease-fire + ETF FOMO round two + dovish Fed pivot.
• Fractals: Prior Golden-Cross extensions averaged +120 % at extreme.
• Price Action: $150 K by summer, $229 K (Fib 2.618 from 2022 low) by year-end.
• Blow-Off: $270 K October spike before the next cyclical bear begins.
________________________________________
11. Strategy Playbook for Traders & Investors
Horizon Bias Instruments Risk Management
Intraday (0–48 h) Range scalp $104–$107 K Perp futures (5× max), options gamma scalping Hard stop $103 K; position <1 % equity
Swing (2–8 wks) Buy pullbacks ahead of Golden Cross Spot, dated futures roll, 1-month $110 K calls Stop $97 K daily close; size 5–10 %
Position (3–6 mo) Accumulate for $140–150 K target Spot, June/Sept call spreads ($120/150) Hedge via 25 % put collar
Long-Term (1–4 yr) Maintain core stash; ignore noise Cold storage, DCA Re-balance only when price doubles
Optional hedge: Long Gold / Short BTC ratio spread as a geopolitical shock absorber; ratio 1.3 currently, mean-reverts to 1.1 post-crises.
________________________________________
12. Conclusion: Delayed, Not Derailed
Bitcoin stands at a crossroads: a textbook Golden Cross beckons, ETF inflows smolder, miners relax, and corporate treasuries drip-feed demand. Yet war headlines and a cautious options market act as sandbags on the balloon. History says macro shocks slow, not stop secular bull cycles. Unless Middle-East conflict strangles global liquidity or the Fed slams the brakes far harder than priced, BTC’s higher-time-frame structure remains bullish. Expect turbulence, embrace risk controls—but don’t mistake a weather delay for a busted engine.
________________________________________
13. Disclaimers
This article is for educational purposes only and does not constitute financial advice. Cryptocurrency investing involves substantial risk; never invest more than you can afford to lose.
Get your free C++ High Frequency Trading ebook at
quantlabsnet.com/registration
Or talk me live 1 on 1 at wa.me/16477809447?text=Hi I saw you on TradingView and I got questions
quantlabsnet.com/registration
Or talk me live 1 on 1 at wa.me/16477809447?text=Hi I saw you on TradingView and I got questions
Related publications
Disclaimer
The information and publications are not meant to be, and do not constitute, financial, investment, trading, or other types of advice or recommendations supplied or endorsed by TradingView. Read more in the Terms of Use.