Technical Analysis Chart
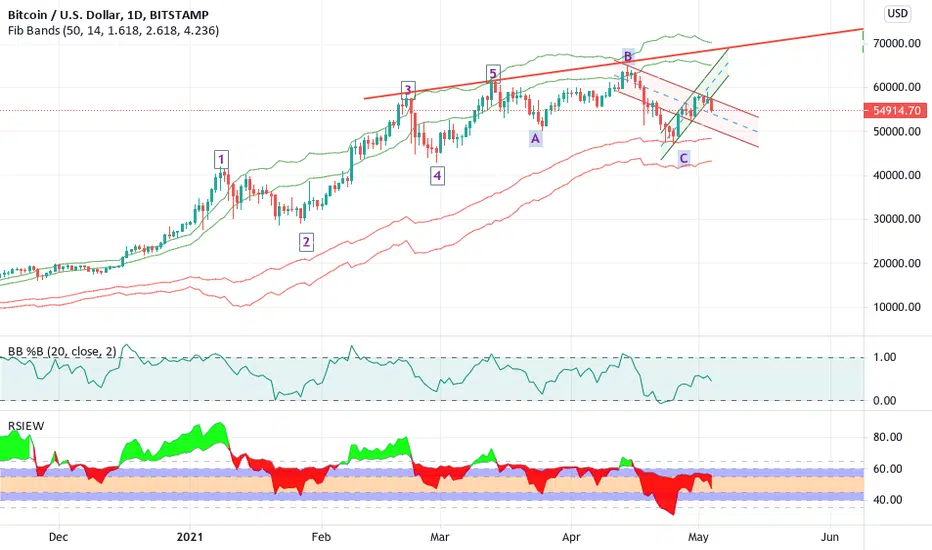
1. Clear Elliott Wave Pattern, 5 impulse wave with ABC Correction.
2. Red and Green parallel zone is the short term bear and bull zone. Upper line in the parallel zone represents resistance and down line represents resistance.
1. Clear Elliott Wave Pattern, 5 impulse wave with ABC Correction.
2. Red and Green parallel zone is the short term bear and bull zone. Upper line in the parallel zone represents resistance and down line represents resistance.
Note
UPDATE on typo- 2. Red and Green parallel zone is the short term bear and bull zone. Upper line in the parallel zone represents resistance and down line represents support.
Disclaimer
The information and publications are not meant to be, and do not constitute, financial, investment, trading, or other types of advice or recommendations supplied or endorsed by TradingView. Read more in the Terms of Use.
Disclaimer
The information and publications are not meant to be, and do not constitute, financial, investment, trading, or other types of advice or recommendations supplied or endorsed by TradingView. Read more in the Terms of Use.