Introduction
Bitcoin (BTC) is currently trading within a symmetrical triangle pattern, forming a series of higher lows and lower highs. This price action indicates a tightening range as the market approaches the apex of the triangle. A breakout is becoming increasingly likely in the coming days, and traders are now watching closely to see which direction BTC will choose. Will it break to the upside or the downside?
Pattern Trading
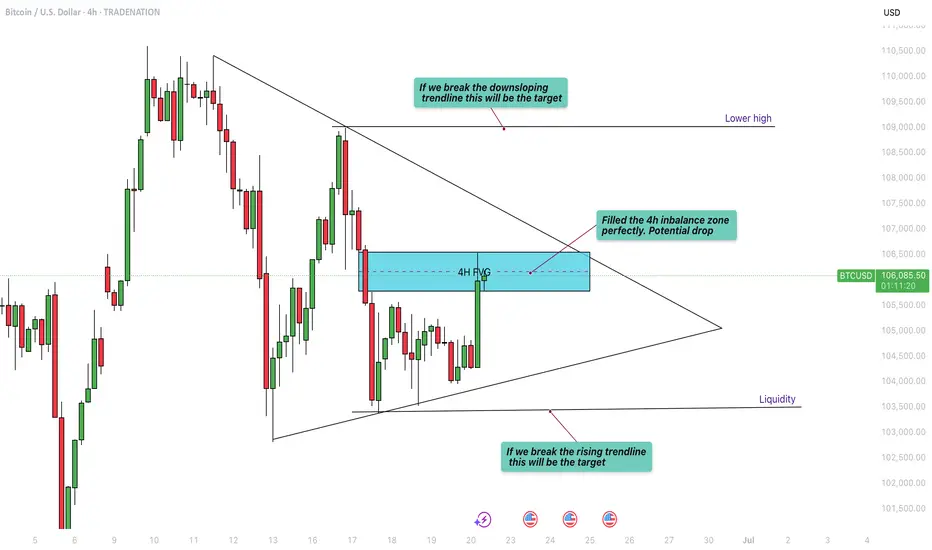
The symmetrical triangle has been a consistent feature of BTC’s recent price action. Price has been oscillating between the descending resistance and ascending support trendlines, gradually compressing the range. Based on the current structure, Bitcoin could continue moving within this pattern until around June 26th, when the triangle becomes extremely narrow and a breakout becomes imminent. Historically, such setups can produce false breakouts or “fake-outs,” where the price temporarily moves in one direction before sharply reversing and breaking out in the opposite direction. These moves often trap traders who enter too early, so caution is advised. Market manipulation is not uncommon in these tight formations, making it essential to wait for confirmation before entering a position.
4H Fair Value Gap (FVG)
Bitcoin has recently filled a 4-hour Fair Value Gap (FVG), a zone that often attracts price due to inefficiencies in the market. Now that this gap has been filled, there could be increased selling pressure, potentially pushing BTC back down toward the lower boundary of the triangle. If BTC is unable to break through the resistance created by this FVG, we may see more bearish momentum. However, should BTC manage to break and hold above this imbalance zone, it would be a strong sign of bullish intent and could open the door for a move to the upside. For now, though, this area remains a significant resistance level.
Upside Target
If BTC manages to break out of the triangle to the upside with strong volume and confirmation, the first major resistance level is around $109,000. This would be a logical target for bulls, as it represents a key zone of liquidity and previous interest. A successful move toward this level would confirm the bullish breakout and could set the stage for further gains, depending on broader market sentiment.
Downside Targets
Conversely, if BTC breaks below the lower trendline of the triangle, the first area to watch is around $103,500. This level is where a significant amount of liquidity has built up, and it could act as initial support. However, if that level fails to hold, the next key psychological level to watch would be $100,000. A drop below this milestone could trigger panic selling and further downside, especially if market sentiment turns negative.
Conclusion
At this point, BTC is at a critical juncture, and traders should remain patient as the market decides its next direction. While the current rejection from the 4H FVG suggests some short-term bearish pressure, the overall pattern remains neutral until a confirmed breakout occurs. Trading within the triangle can be risky due to the possibility of fake-outs, so it’s best to wait for clear confirmation before committing to a trade. Stay cautious, manage your risk carefully, and prepare for volatility as Bitcoin approaches a decisive move.
Disclosure: I am part of Trade Nation's Influencer program and receive a monthly fee for using their TradingView charts in my analysis.
Thanks for your support.
- Make sure to follow me so you don't miss out on the next analysis!
- Drop a like and leave a comment!
Bitcoin (BTC) is currently trading within a symmetrical triangle pattern, forming a series of higher lows and lower highs. This price action indicates a tightening range as the market approaches the apex of the triangle. A breakout is becoming increasingly likely in the coming days, and traders are now watching closely to see which direction BTC will choose. Will it break to the upside or the downside?
Pattern Trading
The symmetrical triangle has been a consistent feature of BTC’s recent price action. Price has been oscillating between the descending resistance and ascending support trendlines, gradually compressing the range. Based on the current structure, Bitcoin could continue moving within this pattern until around June 26th, when the triangle becomes extremely narrow and a breakout becomes imminent. Historically, such setups can produce false breakouts or “fake-outs,” where the price temporarily moves in one direction before sharply reversing and breaking out in the opposite direction. These moves often trap traders who enter too early, so caution is advised. Market manipulation is not uncommon in these tight formations, making it essential to wait for confirmation before entering a position.
4H Fair Value Gap (FVG)
Bitcoin has recently filled a 4-hour Fair Value Gap (FVG), a zone that often attracts price due to inefficiencies in the market. Now that this gap has been filled, there could be increased selling pressure, potentially pushing BTC back down toward the lower boundary of the triangle. If BTC is unable to break through the resistance created by this FVG, we may see more bearish momentum. However, should BTC manage to break and hold above this imbalance zone, it would be a strong sign of bullish intent and could open the door for a move to the upside. For now, though, this area remains a significant resistance level.
Upside Target
If BTC manages to break out of the triangle to the upside with strong volume and confirmation, the first major resistance level is around $109,000. This would be a logical target for bulls, as it represents a key zone of liquidity and previous interest. A successful move toward this level would confirm the bullish breakout and could set the stage for further gains, depending on broader market sentiment.
Downside Targets
Conversely, if BTC breaks below the lower trendline of the triangle, the first area to watch is around $103,500. This level is where a significant amount of liquidity has built up, and it could act as initial support. However, if that level fails to hold, the next key psychological level to watch would be $100,000. A drop below this milestone could trigger panic selling and further downside, especially if market sentiment turns negative.
Conclusion
At this point, BTC is at a critical juncture, and traders should remain patient as the market decides its next direction. While the current rejection from the 4H FVG suggests some short-term bearish pressure, the overall pattern remains neutral until a confirmed breakout occurs. Trading within the triangle can be risky due to the possibility of fake-outs, so it’s best to wait for clear confirmation before committing to a trade. Stay cautious, manage your risk carefully, and prepare for volatility as Bitcoin approaches a decisive move.
Disclosure: I am part of Trade Nation's Influencer program and receive a monthly fee for using their TradingView charts in my analysis.
Thanks for your support.
- Make sure to follow me so you don't miss out on the next analysis!
- Drop a like and leave a comment!
Trade active
We filled the 4H inbalance zone as expected a drop down. The moved caused a breakdown from the triangle and went straight towards the target🔸 Free trading Discord
discord.gg/fVfJHHQSMG
🔹 Free trading signals
t.me/CandleCollective
discord.gg/fVfJHHQSMG
🔹 Free trading signals
t.me/CandleCollective
Related publications
Disclaimer
The information and publications are not meant to be, and do not constitute, financial, investment, trading, or other types of advice or recommendations supplied or endorsed by TradingView. Read more in the Terms of Use.
🔸 Free trading Discord
discord.gg/fVfJHHQSMG
🔹 Free trading signals
t.me/CandleCollective
discord.gg/fVfJHHQSMG
🔹 Free trading signals
t.me/CandleCollective
Related publications
Disclaimer
The information and publications are not meant to be, and do not constitute, financial, investment, trading, or other types of advice or recommendations supplied or endorsed by TradingView. Read more in the Terms of Use.