#Bitcoin Normal Overview:-
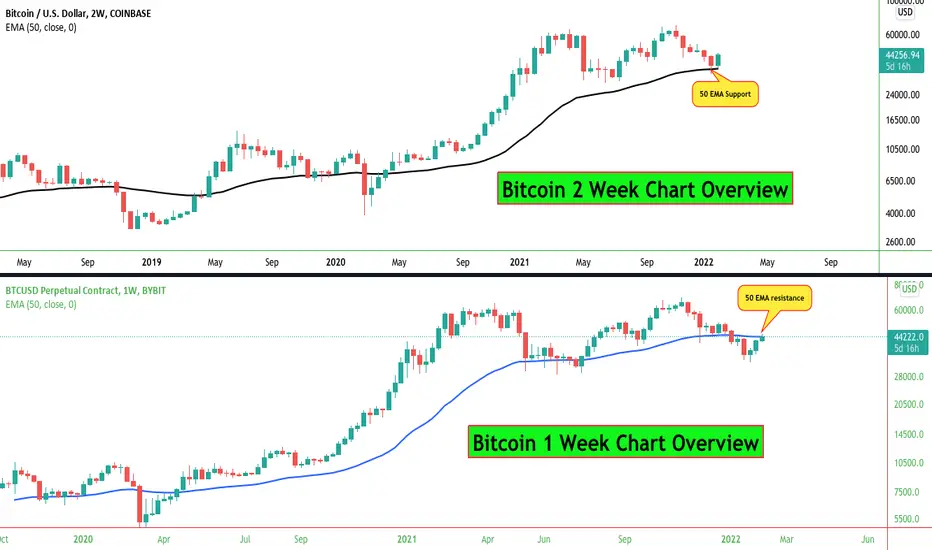
#BTCUSDT 2 Week chart :-
As Per 2 Week chart 50 EMA working Strong support level.
#BTCUSDT 1 Week Chart :-
As Per 1 Week Chart 50 EMA Working as Resistance.
If 2 Week candle close above $44000 then Good For More Upside move.
Next Weekly candle close in 5 Day 16 hours.
Otherwise we can see $41500 level.
2 Week 50 EMA Support = $35629
1 Week 50 EMA resistance = $44167
Twitter: twitter.com/CryptoPatel
Telegram: t.me/OfficialCryptoPatel
Instagram: instagram.com/cryptopatel?utm_medium=copy_link
Telegram: t.me/OfficialCryptoPatel
Instagram: instagram.com/cryptopatel?utm_medium=copy_link
Disclaimer
The information and publications are not meant to be, and do not constitute, financial, investment, trading, or other types of advice or recommendations supplied or endorsed by TradingView. Read more in the Terms of Use.