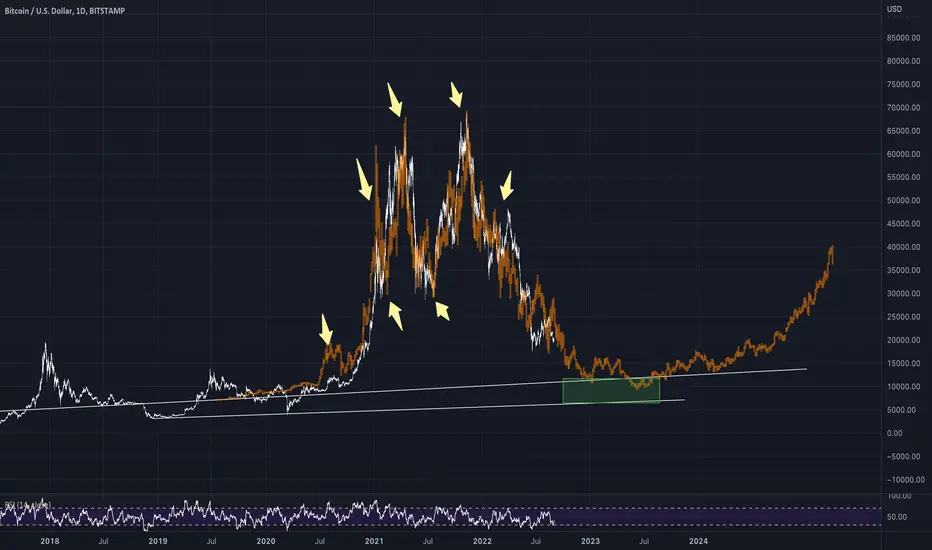
This chart resembles a correlation between BTC and AMZN (early days).
Anywhere near $10,000 or below will see a heavy buy resistance and will likely accumulate for a year before initiating a new bull cycle.
Of course, BTC might take a different stance and decouple from this pattern due to regulations and restriction, but very interesting to see how it ends.
If you're excited to see where would this end if BTC to follow AMZN foot steps for another 10 years comment below.
Thank you and Do your own research.
Note
IF and only IF Bitcoin continues on Amazons path.. $21,000,000.. Thats equivalant to the amount of bitcoins mined. Coincidence? (This is only possible IF the USD tanks and is basically worthless) Disclaimer
The information and publications are not meant to be, and do not constitute, financial, investment, trading, or other types of advice or recommendations supplied or endorsed by TradingView. Read more in the Terms of Use.
Disclaimer
The information and publications are not meant to be, and do not constitute, financial, investment, trading, or other types of advice or recommendations supplied or endorsed by TradingView. Read more in the Terms of Use.