🔍1. General Context and Short-Term Trend
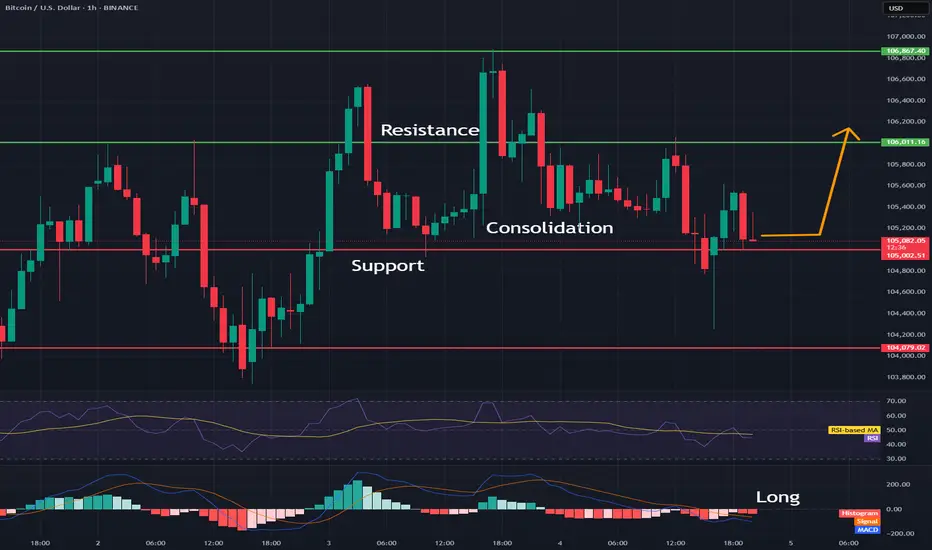
Short-Term Trend: The last dozen or so candles have shown strong fluctuations — a typical sideways market (consolidation) after a clear upward impulse and a quick drop. The price is currently trading in the range of around $104,900–$106,500.
Recent Strong Move: Clear upward impulse from around $104,900 to around $106,900, followed by a quick correction.
📌2. Supports and Resistances (H1)
Supports:
$105,000–$105,200 — Bottom of local wicks and several demand tests.
$104,900 — Lowest point of the last few hours, clear buyer reaction.
Resistances:
$106,200–$106,400 — Upper area of several candles, strong price rejection.
106,900–107,000 USD – The peak of the last impulse, a place of clear supply.
✅3. Candlestick formations and price action
Pin bar / long wick: Candles with long lower wicks are visible around 105,000 USD, which suggests that buyers are defending support.
Double top? (Double top): Peaks around 106,900 USD (03.06 and 04.06) – a classic signal of a potential change in direction to the lower.
Possible consolidation: The last few hours have been a series of alternating candles, signaling the lack of a clear advantage of bulls or bears.
🧠4. Technical indicators (MACD and RSI)
MACD (lower panel)
The MACD line crossed the signal line from the bottom to the top, then a quick correction and currently the MACD is close to zero – no clear trend, momentum has slowed down.
MACD Histogram: Declining, close to zero, suggesting potential lack of strong trend and possibility of further consolidation.
RSI (middle panel)
RSI value ~44–48 – not overbought or oversold, neutral market state.
No divergence – RSI generally follows price, no strong divergences are visible.
RSI bounced off 30 (tested oversold zone and returned to neutral range).
🧠5. What could be important?
Volatility Squeeze: Low volatility after a sharp move often heralds another impulse.
Potential Fakeout: If support at $104,900 is broken falsely (e.g. quick wick and return), a move up could occur.
No clear trend on the hourly chart, rather sideways market in the short term.
📊Summary and scenarios
Scenario 1 (bullish):
If the $105,000-$104,900 level holds, we can expect a test of $106,200-$106,400 and perhaps another attempt to approach $107,000.
Scenario 2 (bearish):
If the $104,900 support is broken (with a candle closed below this level), the next target is around $104,500 and below.
What to watch out for?
Timing of macro data releases - may increase volatility.
Sudden breakouts from consolidation - no trend = higher risk of sudden, false moves.
Disclaimer
The information and publications are not meant to be, and do not constitute, financial, investment, trading, or other types of advice or recommendations supplied or endorsed by TradingView. Read more in the Terms of Use.
Disclaimer
The information and publications are not meant to be, and do not constitute, financial, investment, trading, or other types of advice or recommendations supplied or endorsed by TradingView. Read more in the Terms of Use.