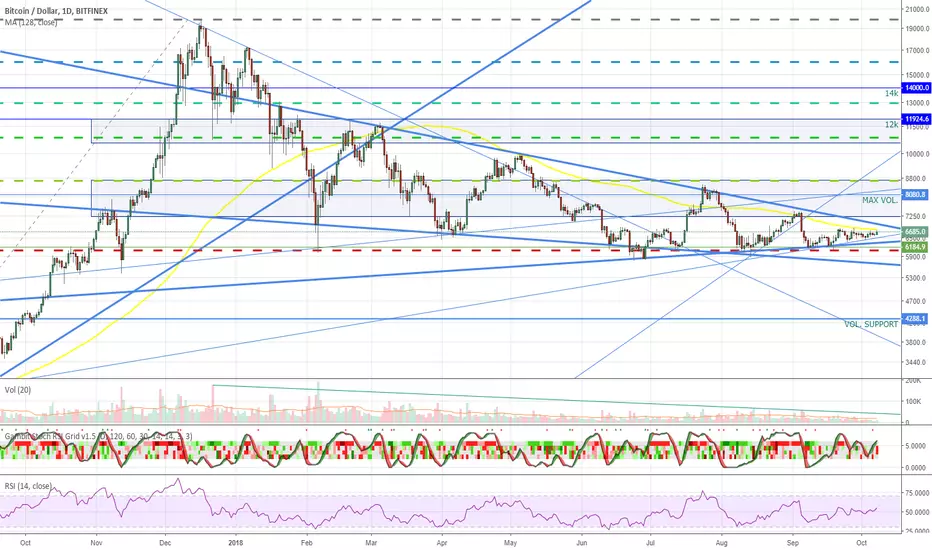
Consolidation triangle (reflecting price peaks and valleys) is getting narrower and volume is getting lower, so we should expect a breakout soon.
After long bear and bouncing from $6000ish a few times, I think BTC is getting ready to make it's move. The question is just, which way?
I wouldn't be surprised if (before ending this bear trend) we re-test support or drop lower and create a long wick on higher timeframes. I think that, if prices are able to back to current levels, would make a great case for next bull cycle.
Note
According to historical data yellow MA line seems significant. Notice that since we broke it down on February 1st 2018 we have problems getting and staying above, so doing that could mean a bullish signal.Until then it will act as resistance (for the past few days it seems like its keeping/pushing BTC down).
Note
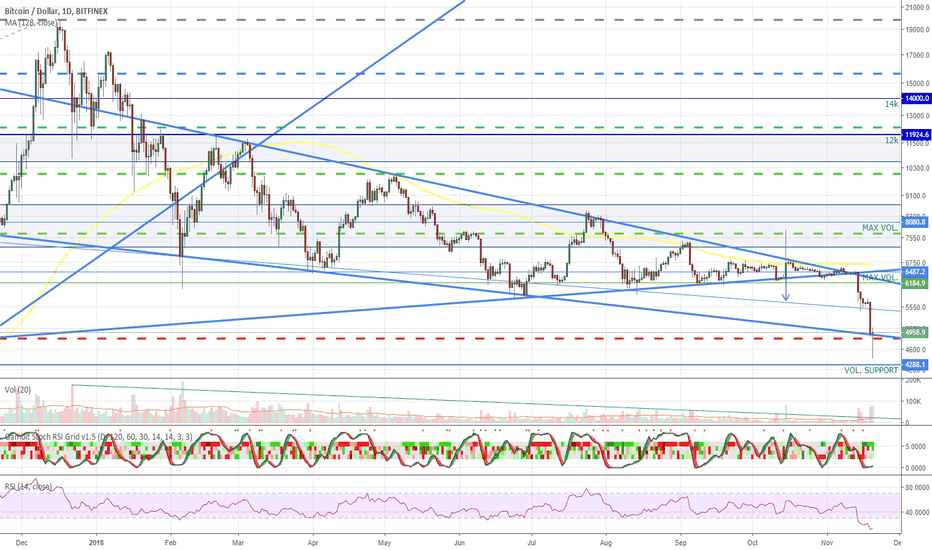
2 trend lines broken...lets see how many bulls there are to push the price back above. Next supports are at 6000 and 5800.
Note
Falling wedge resistance seem to have been broken with large volume (23% spike on daily chart). Staying and closing above could be bullish for crpyto.Note
We failed to close above. Guess it wasn't real breakout but just FUD because of USDT. It may also be a good trap for people waiting for entry if we go back down.Note
Moving average held price for 3 days (3 closes above it), but looks like it could be broken with this down move. Let's see today's close price...Note
Up or down? Tighten your seat-belts! :)Note
BTC seemed quite stable for 9 days since last comment, today it finally broke down.If 6k-ish doesn't hold, I think next support is around 5,5k.
Note
5.5k$ has just been broken and I think there are some chances we bounce here. If not I see 4,3k as next support.
Note
BTC is holding quite well at these levels for now. I think if daily candle closes above $5,5k this would mean higher chances for bounce back up to $6k area:Note
I've noticed RSI is also quite low and may slowly start to signal a reversal - at least short term. Beside that notice that it hasn't been in this area exactly since start of previous bull run around 17th of August 2015 when price was 220$ (although as you can see RSI reached these levels before reversal).
Note
Last triangle has been broken down...if daily candle closes bellow the triangle, BTC bear times may get extend (supports at 4,8k and 4,3k).Note
RSI got even lower and is now lower than in 2015. I would expect a strong bounce back because of that.Note
We didn't reach 4,3k but got close, and we are back to around 4,8k.Since we broke triangle, here is an updated analysis:
Related publications
Disclaimer
The information and publications are not meant to be, and do not constitute, financial, investment, trading, or other types of advice or recommendations supplied or endorsed by TradingView. Read more in the Terms of Use.
Related publications
Disclaimer
The information and publications are not meant to be, and do not constitute, financial, investment, trading, or other types of advice or recommendations supplied or endorsed by TradingView. Read more in the Terms of Use.