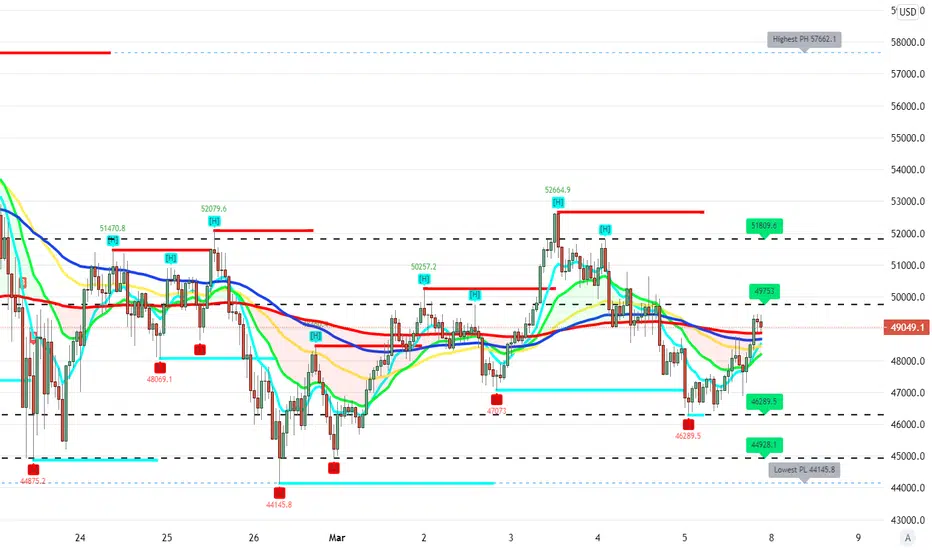
Key chart levels are important technical levels at which a financial instrument could face increased buying or selling pressure. Traders look out for key chart levels to place their buy and sell orders around those lines, which accelerates price-moves and increases volatility when the price reaches those levels. When looking to sell a currency pair, traders can look for the short or faster moving average to cross below a falling slower moving average as a sell signal. The most well-known moving average crossovers involve the 50 (51) and 200 moving averages. Support occurs when falling prices stop, change direction, and begin to rise. ... Resistance is a price level where rising prices stop, change direction, and begin to fall. Resistance is often viewed as a “ceiling” keeping prices from rising higher. When you combine these powerful tools with patience and good technical analysis you have a solid setup. This set up is made to be clean and beginner friendly. Please give it a try, and put your own spin on it.
Disclaimer
The information and publications are not meant to be, and do not constitute, financial, investment, trading, or other types of advice or recommendations supplied or endorsed by TradingView. Read more in the Terms of Use.
Disclaimer
The information and publications are not meant to be, and do not constitute, financial, investment, trading, or other types of advice or recommendations supplied or endorsed by TradingView. Read more in the Terms of Use.