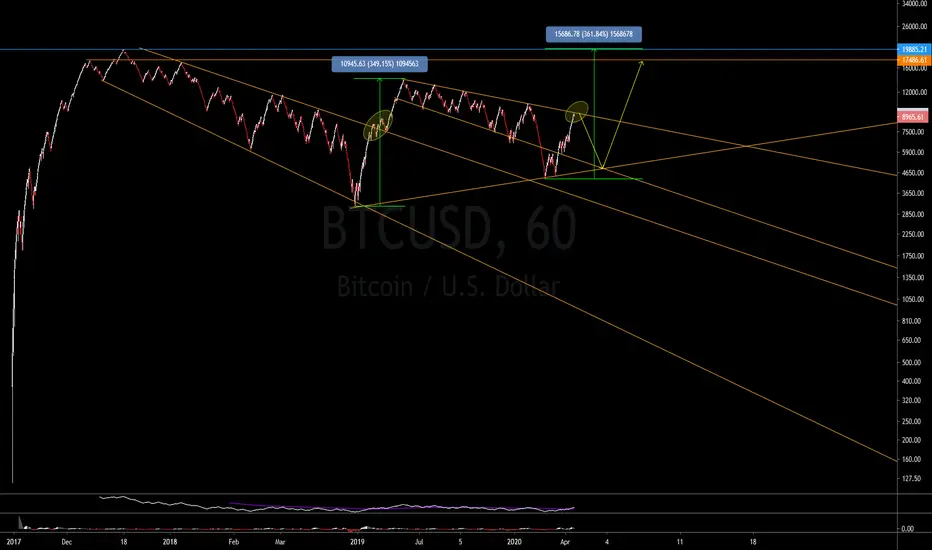
Curious chart, it's quite similar in structure to the last run from 3k's to 14k, we started higher this time.. 3.4k, bouncing of a now established uptrend.
the point of interest in this chart is marked by the yellow circles, where we were rejected and retested last time to break through and hit 14k's.
I'll be watching for some similar action in the near future to present some confirmation.
obviously, a failure to break the level could see us take quite a deep retracement coming into the halving.
also, let's remember that the last halving event lead to a 30% dump, before the new ATH was achieved, with any luck we'll see that again, and pick up some more discounts.
Disclaimer
The information and publications are not meant to be, and do not constitute, financial, investment, trading, or other types of advice or recommendations supplied or endorsed by TradingView. Read more in the Terms of Use.
Disclaimer
The information and publications are not meant to be, and do not constitute, financial, investment, trading, or other types of advice or recommendations supplied or endorsed by TradingView. Read more in the Terms of Use.