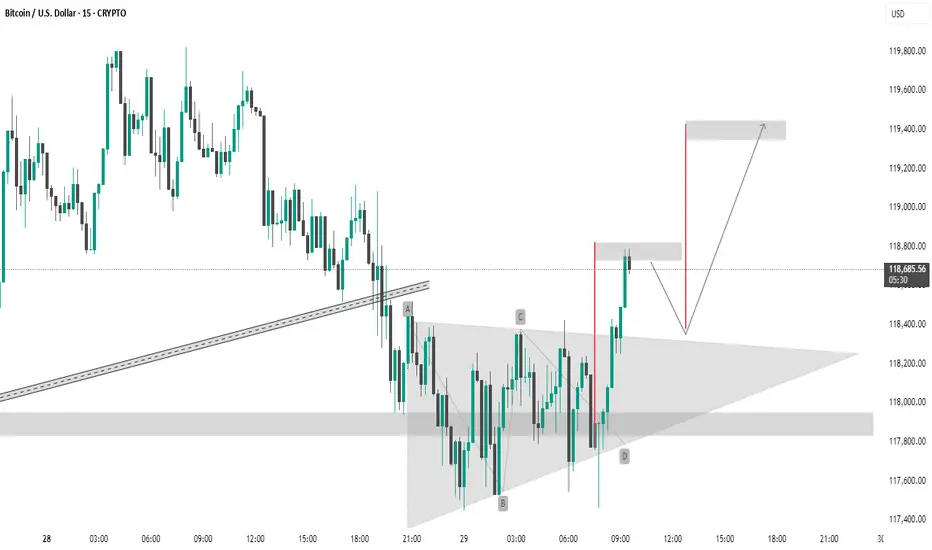
This Bitcoin (BTC/USD) 15-minute chart shows a symmetrical triangle breakout. The pattern labeled A-B-C-D indicates consolidation within the triangle, followed by a bullish breakout. The price has broken above the upper trendline and is approaching the resistance zone around 118,800–119,400 USD. The chart suggests two scenarios:
Immediate breakout to the 119,400 resistance.
Short-term pullback to retest the breakout zone (~118,600), followed by a continuation to 119,400.
The setup implies a bullish bias with a potential upside target around 119,400 USD.
thanking you
Immediate breakout to the 119,400 resistance.
Short-term pullback to retest the breakout zone (~118,600), followed by a continuation to 119,400.
The setup implies a bullish bias with a potential upside target around 119,400 USD.
thanking you
Related publications
Disclaimer
The information and publications are not meant to be, and do not constitute, financial, investment, trading, or other types of advice or recommendations supplied or endorsed by TradingView. Read more in the Terms of Use.
Related publications
Disclaimer
The information and publications are not meant to be, and do not constitute, financial, investment, trading, or other types of advice or recommendations supplied or endorsed by TradingView. Read more in the Terms of Use.