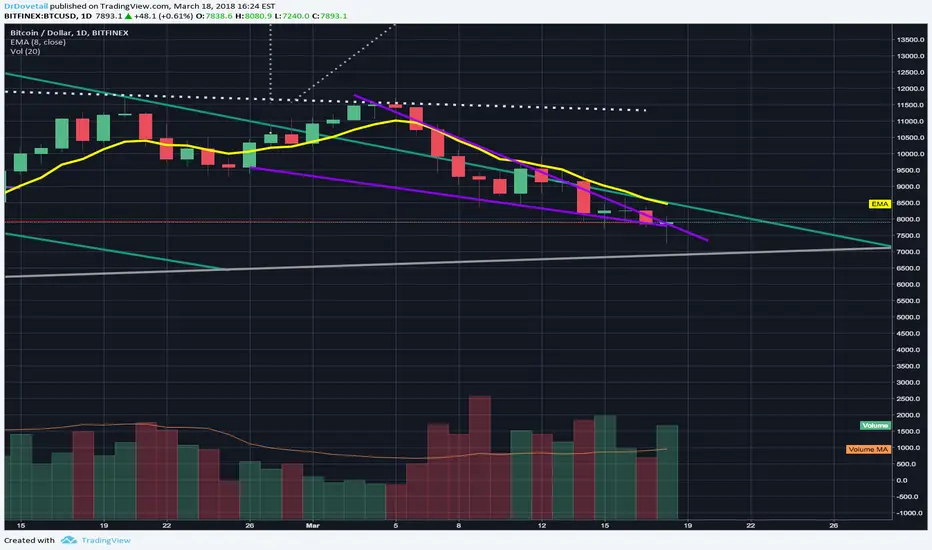
One potential upside to mention is that the "dread and shoulders" pattern has within it a very sizeable descending wedge which basically consists of both the head and the right shoulder....descending wedges tend to break towards the upside....so if we see a bullish breakout with lots of bull momentum to go with it and a bullish volume spike and then a double close above the descending wedge on the 4 hour chart then that would be a great scenario causing me to switch from neutral where I'm currently at to long. We just saw a huge bullish spike from 7500 to 8000 which is a great sign that we will be breaking out of the descending wedge instead of breaking down under the head and shoulders...but keep in mind this too could be a fake breakout so tread lightly and wait for those confirmation candles and bullish spikes in volume before assuming we have a valid descending wedge breakout. Great analysts like Haejin Lee have been noticing a descending wedge which is a fractal of a previous larger descending wedge and at least right now it's currently looking like that is correct. Always anticipate a false breakout and set your stop losses accordingly though to protect yourself.
Note
if we do have a successful breakout above the descending wedge the target price jump is right around 9600.Disclaimer
The information and publications are not meant to be, and do not constitute, financial, investment, trading, or other types of advice or recommendations supplied or endorsed by TradingView. Read more in the Terms of Use.
Disclaimer
The information and publications are not meant to be, and do not constitute, financial, investment, trading, or other types of advice or recommendations supplied or endorsed by TradingView. Read more in the Terms of Use.