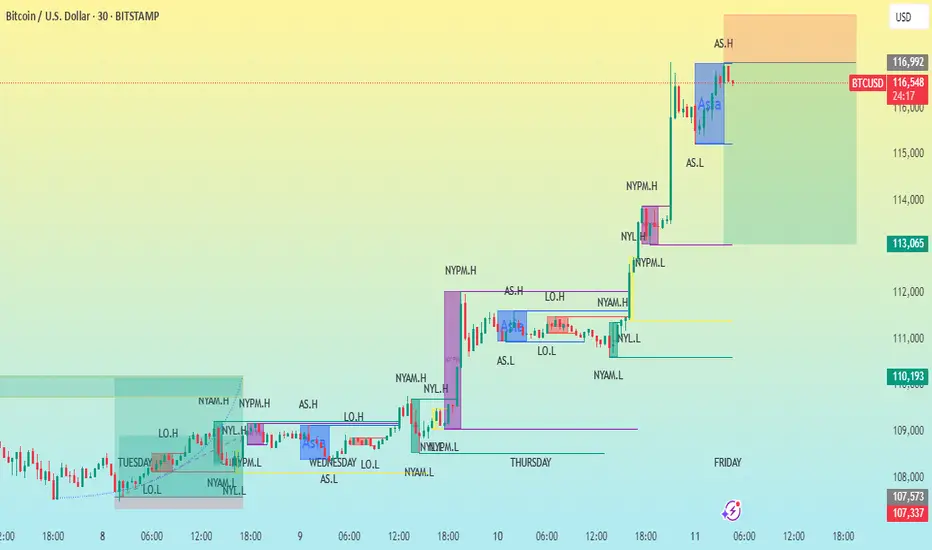
This chart shows the price action of Bitcoin (BTC/USD) on a 30-minute timeframe, with a variety of session-specific high and low labels and possible trade setup zones. Here's a breakdown of the key components and what they indicate:
---
1. Timeframe & Instrument
Instrument: Bitcoin vs. U.S. Dollar (BTC/USD)
Timeframe: 30-minute candles
Exchange: Bitstamp
Date Range: July 8–11, 2025
---
2. Session Labels
The chart includes key session high/low markers which are common in institutional trading analysis:
NYAM.H / NYAM.L: New York AM session High/Low
NYPM.H / NYPM.L: New York PM session High/Low
AS.H / AS.L: Asia session High/Low
LO.H / LO.L: London Open High/Low
NYL.H / NYL.L: New York Lunch High/Low
These session levels are often used to identify liquidity pools or areas where price might react due to prior institutional activity.
---
3. Trade Setup Zones
Orange box (top): Likely a sell-side liquidity or resistance zone, possibly a target for a long trade.
Green box (bottom): Likely a buy-side liquidity or support zone, possibly a stop loss or retracement target.
These zones often represent risk-reward blocks based on prior session data or imbalance fill areas.
---
4. Price
Current Price: ~$116,586
Recent High (AS.H): $116,992
Key Support Levels: $113,065 and $110,193 (from prior session lows)
---
5. Price Structure
The chart shows a clear uptrend, with higher highs and higher lows.
Breakouts followed by consolidations near session highs suggest bullish momentum.
Potential continuation of the uptrend unless the price breaks below the previous session low (marked NYPM.L or NYL.L).
---
Conclusion
This is a well-marked institutional-style price action chart, likely using ICT (Inner Circle Trader) or SMC (Smart Money Concepts) principles. It’s showing bullish strength with multiple liquidity grabs followed by expansions to the upside. Key levels for future movement include:
Break and close above AS.H → Potential continuation toward next liquidity zone.
Drop below NYPM.L or NYL.L → Potential reversal or retracement.
Let me know if you'd like help planning a trade based on this chart!
---
1. Timeframe & Instrument
Instrument: Bitcoin vs. U.S. Dollar (BTC/USD)
Timeframe: 30-minute candles
Exchange: Bitstamp
Date Range: July 8–11, 2025
---
2. Session Labels
The chart includes key session high/low markers which are common in institutional trading analysis:
NYAM.H / NYAM.L: New York AM session High/Low
NYPM.H / NYPM.L: New York PM session High/Low
AS.H / AS.L: Asia session High/Low
LO.H / LO.L: London Open High/Low
NYL.H / NYL.L: New York Lunch High/Low
These session levels are often used to identify liquidity pools or areas where price might react due to prior institutional activity.
---
3. Trade Setup Zones
Orange box (top): Likely a sell-side liquidity or resistance zone, possibly a target for a long trade.
Green box (bottom): Likely a buy-side liquidity or support zone, possibly a stop loss or retracement target.
These zones often represent risk-reward blocks based on prior session data or imbalance fill areas.
---
4. Price
Current Price: ~$116,586
Recent High (AS.H): $116,992
Key Support Levels: $113,065 and $110,193 (from prior session lows)
---
5. Price Structure
The chart shows a clear uptrend, with higher highs and higher lows.
Breakouts followed by consolidations near session highs suggest bullish momentum.
Potential continuation of the uptrend unless the price breaks below the previous session low (marked NYPM.L or NYL.L).
---
Conclusion
This is a well-marked institutional-style price action chart, likely using ICT (Inner Circle Trader) or SMC (Smart Money Concepts) principles. It’s showing bullish strength with multiple liquidity grabs followed by expansions to the upside. Key levels for future movement include:
Break and close above AS.H → Potential continuation toward next liquidity zone.
Drop below NYPM.L or NYL.L → Potential reversal or retracement.
Let me know if you'd like help planning a trade based on this chart!
t.me/+vT7LZx7w13BlNjI0
✅ XAUUSD SIGNALS
💯JOIN FREE TELEGRAM CHANNEL
t.me/+vT7LZx7w13BlNjI0
✔REGISTERED broker
partners.vantagemarkets.com/ib-cpa-register/?url=ib&affid=7264705
✔Referral code 72647
✅ XAUUSD SIGNALS
💯JOIN FREE TELEGRAM CHANNEL
t.me/+vT7LZx7w13BlNjI0
✔REGISTERED broker
partners.vantagemarkets.com/ib-cpa-register/?url=ib&affid=7264705
✔Referral code 72647
Disclaimer
The information and publications are not meant to be, and do not constitute, financial, investment, trading, or other types of advice or recommendations supplied or endorsed by TradingView. Read more in the Terms of Use.
t.me/+vT7LZx7w13BlNjI0
✅ XAUUSD SIGNALS
💯JOIN FREE TELEGRAM CHANNEL
t.me/+vT7LZx7w13BlNjI0
✔REGISTERED broker
partners.vantagemarkets.com/ib-cpa-register/?url=ib&affid=7264705
✔Referral code 72647
✅ XAUUSD SIGNALS
💯JOIN FREE TELEGRAM CHANNEL
t.me/+vT7LZx7w13BlNjI0
✔REGISTERED broker
partners.vantagemarkets.com/ib-cpa-register/?url=ib&affid=7264705
✔Referral code 72647
Disclaimer
The information and publications are not meant to be, and do not constitute, financial, investment, trading, or other types of advice or recommendations supplied or endorsed by TradingView. Read more in the Terms of Use.