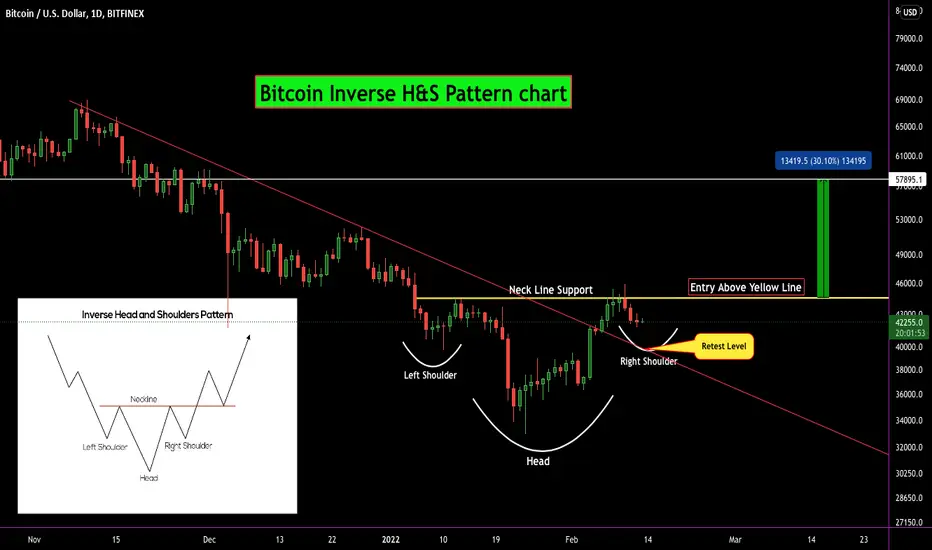
#BITCOIN Inverse H&S Pattern:-
#BTC/USDT currently trading at $42200
As Per chart I am expecting some more Downtrend till $39000-$40000
Perfect Right Shoulder bottom could be $40700
But If any Daily Candle close below $40000 then IMO Exit will be good decision.
Inverse H&S pattern also Forming at Bottom so High Probably to breakout Upward sideZ
If break Yellow Neck Line resistance that mena Bullish Toward $58000
Never Do gambling with High Leverage.
Support:- $40000
Resistance:- $44500/$51000/$58000
Twitter: twitter.com/CryptoPatel
Telegram: t.me/OfficialCryptoPatel
Instagram: instagram.com/cryptopatel?utm_medium=copy_link
Telegram: t.me/OfficialCryptoPatel
Instagram: instagram.com/cryptopatel?utm_medium=copy_link
Disclaimer
The information and publications are not meant to be, and do not constitute, financial, investment, trading, or other types of advice or recommendations supplied or endorsed by TradingView. Read more in the Terms of Use.