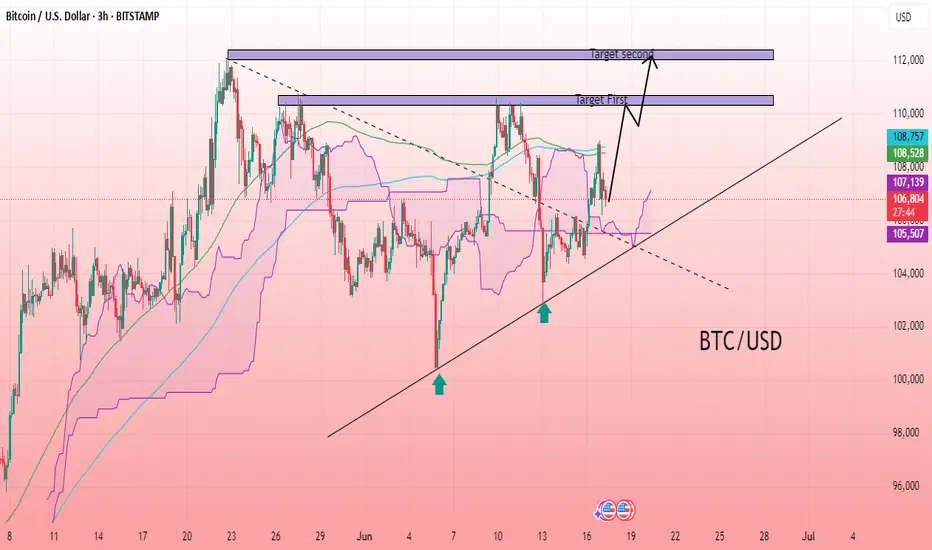
The BTC/USD 3-hour chart shows a bullish reversal forming from a higher low structure along a rising trendline, indicating increasing buyer strength. Price action has broken above the Ichimoku cloud and is now testing resistance levels, suggesting bullish momentum. The chart also highlights confluence with dynamic support from the 250 and 370-period DEMA indicators, adding to the strength of the uptrend. A breakout above current resistance may lead to continuation toward the marked target zones. Overall sentiment favors a bullish move with clear upside potential if momentum sustains and no major rejection occurs from the resistance zones.
Entry Point: 106,600
First Target: 110,360
Second Target: 112,000
Entry Point: 106,600
First Target: 110,360
Second Target: 112,000
Join telegram channel free ..
t.me/GoldMan0009
Forex, Gold & Crypto Signals with detailed analysis & get consistent results..
Gold Signal's with proper TP & SL for high profit opportunities..
t.me/GoldMan0009
t.me/GoldMan0009
Forex, Gold & Crypto Signals with detailed analysis & get consistent results..
Gold Signal's with proper TP & SL for high profit opportunities..
t.me/GoldMan0009
Disclaimer
The information and publications are not meant to be, and do not constitute, financial, investment, trading, or other types of advice or recommendations supplied or endorsed by TradingView. Read more in the Terms of Use.