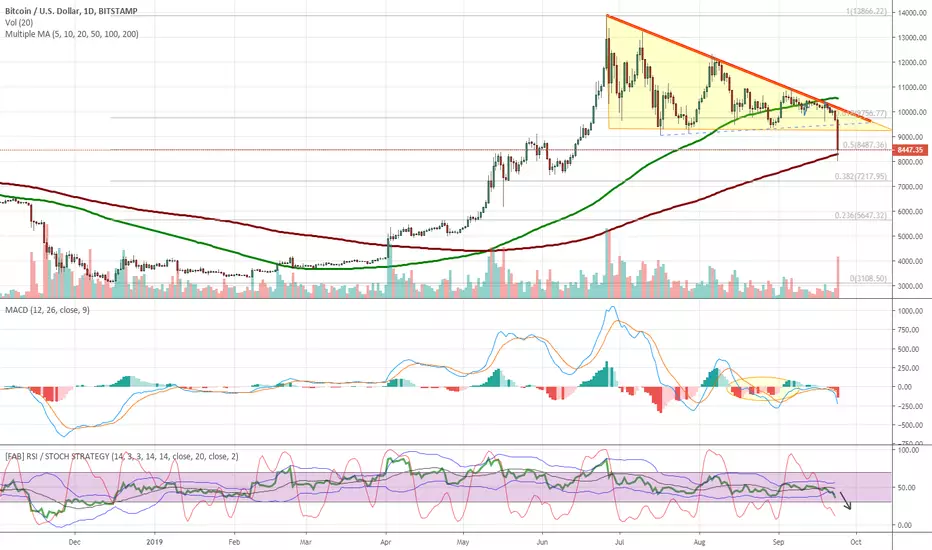
We waited for the bears to rage like this since late july, within our previous analysis.
We observed that big descending triangle finally breaking down today.
Now the bears are finally striking the market.
Yet for us is time to move forward.
SHORT TERM
As you may see today's flashcrash moved toward FIB 0.5 ( 8500$) retracement and SMA200/D in 8200$ area.
Since today we have a TD count=9 we'd better wait for daily close.
We're looking for some local rebound along the way down.
MEDIUM TERM
While the bears may push price down well under 8000$ and deep into 7000$ range eventually, we'd better focus on medium term.
On weekly timeframe we have the SMA 100/W ( GREEN LINE ) raising from 7700$ area and it's highly likely (in the case) it will act as elastic support.

That's a very meaningful support, historically.
As long as it does not get broken on a weekly close we should assume bulls still have still something up their sleeves.
Personally i don't think the uptrend is over, this is just a well deserved pause along the way up.
We observed that big descending triangle finally breaking down today.
Now the bears are finally striking the market.
Yet for us is time to move forward.
SHORT TERM
As you may see today's flashcrash moved toward FIB 0.5 ( 8500$) retracement and SMA200/D in 8200$ area.
Since today we have a TD count=9 we'd better wait for daily close.
We're looking for some local rebound along the way down.
MEDIUM TERM
While the bears may push price down well under 8000$ and deep into 7000$ range eventually, we'd better focus on medium term.
On weekly timeframe we have the SMA 100/W ( GREEN LINE ) raising from 7700$ area and it's highly likely (in the case) it will act as elastic support.
That's a very meaningful support, historically.
As long as it does not get broken on a weekly close we should assume bulls still have still something up their sleeves.
Personally i don't think the uptrend is over, this is just a well deserved pause along the way up.
Note
Previous analisys, dating back to july / august:
Note
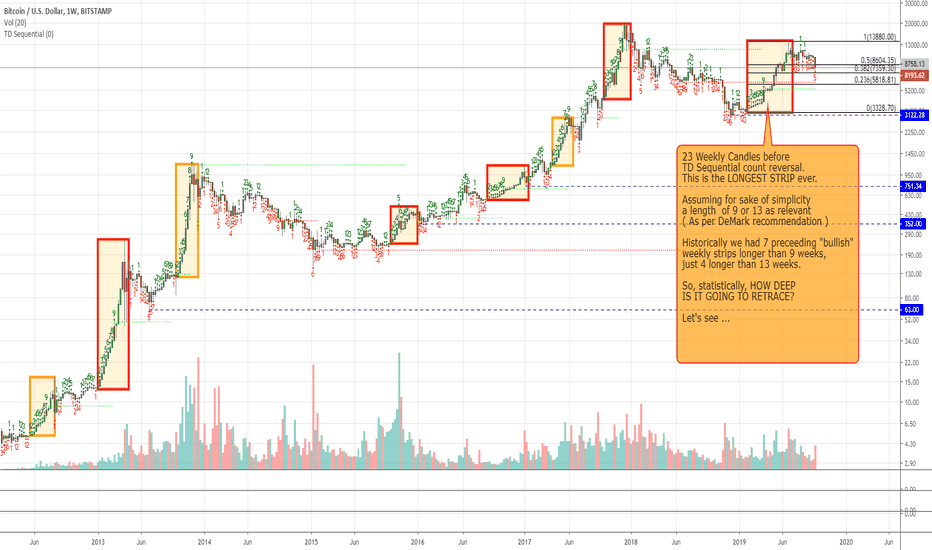
By the way, the TD count as of today.Note
We'll see if we can have some count 9 or 13 reversal.Note
Educational post here:
Note
While our aim is to possibly ( methodically ) accumulate lower, for now we cannot yet rule out a simple "consolidation" move. That's plan B, so let's avoid being caught off guard in the case.Note
Mind this: next 3-4 days are crucial for the trend.Many reasons, let me cite just 2:
1) after a RED TD count 9 yesterday we may move towards a TD count 13.
2) On Friday we have the CME futures expiration.
So i'd expect further short term volativity and possibly fase signals.
When in doubt look at volume.
Note
Not so pretty.Anyway, volume is very low.
We'll see.
Note
Broke up.Note
Well it's still Plan A, as you noticed ...meaning ( in my case ) methodically accumulating on dips, this till low 7000$ eventually.
Anyway, today price broke SMA200/D support on volume and quickly moved to the next support. As per opening post, we knew this support was SMA100/W, just above 7700$.
Price moved right there:
That's a meaningful medium term level so, whatever it happens short term, bulls should try their best to keep price over it on sunday close.
Failing that we may expect a longer, deeper correction.
I think CME futures expiration ( tomorrow ) is playing a role in this (well deserved) correction, hence i'm looking forward to price action along the weekend.
We have now a decent chance of a rebound within 24/48h, we'll see.
Note
Unsurprigingly price bounced up already 6/7% over the aforementioned SMA100 / W support.Now it's important to check today close, as we may have a perfect TD count 13 on the daily timeframe. Hence a further pause, a pullback or a reversal.
Tomorrow weekly close will be even more important, as bulls should try to keep price over support.
Interesting times ahead.
Note
Weekly close above the aforementioned SMA10/W support.Given the recent re-test of support after rebound, we may have a short term double bottom confirmation *AS LONG* as bulls will break-up both resistance and 8350$ area.
Volume still lackiing, we'll see.
Note
Sorry for typos above: SMA100/W, not SMA10/W.Note
if bulls fail the breakout we may have confirmation of another descending triangle. So better for them to succeed ...
Note
Bulls trying, now they're close to 8350$.yet they need more volume or they'll lose steam fast.
Note
Daily close at 8298$ and mediocre volume.Still not enough.
Note
In case you wonder, that's why bulls struggle so much here:FIB 0.5 + SMA200/D
Note
Come on bulls, let's see what you can do ...Note
Testing SMA200/D again ...
Note
And badly rejected. Again.Note
Macro short term scenario, as of today.1) Breakdown of the yellow descending triangle.
2) ABC correction to SMA 100/W ( Not marked here, about 7700$ ).
3) Bounce rejected yesterday by SMA200/D and overall FIB 0.5 resistance at 8500$.
4) Minor double bottom scenario pending and still not confirmed or invalidated by volume nor daily close.
Yes, a pretty sluggish bounce so far:
Yet we may have some accumulation ongoing here.
Daily oscillators are still supportive of a rebound.
Assuming here a very sparse flag/pennant (fuchsia), ***for now*** there's still a potential 'exit route' for bulls, consisting in that rawly traced 'dotted blue' support.
Short term, as long as 7900 / 8000$ holds, a movement to the upper bound of the (fuchsia) flag/pennant seems still possible and would fit well a minor double bottom scenario.
This keeping in mind the latter should be confirmed beforehand by a noticeable volume spike and/or a daily close above 8360$. Closest resistance area is still 8500$ ( SMA200/D + FIB 0.5 ).
Bulls may try, once again, to pierce MM200/D and exploit a pending minor double bottom in order to move towards 9000 +/-100$ area ( mind a minor resistance at about 8700$ ).
Obvious flip of the coin would be losing 7900$: while i'd rate this less likely short term, that would imply a pretty risky retest of SMA100/W ( recent lows ), considering next meaningful support would be overall FIB 0.382 at about 7200/7300$.
Some (weekly / medium term) probabilistic retrace speculation already posted here:
BOTTOM LINE: plan is still accumulating on dips.
Yet, given a decent R:R ratio here i'm anticipating a further 'Long' about here (8090$), with a Stop loss just under recent low.
It's risky, yet potential opportunity is well worth a slight loss imho.
Note
SOme oscillators on daily:Awaiting MACD VXI crossover.
Note
Price within the aforementioned support area ( 7900-8000 $ ).Crossroad ahead.
Wait for breakout and act accordingly.
Note
Zooming out.I think bias is for a bullish breakout giving that medium term support and state of short term oscillators. Anyway that's marginal as volume is pretty low, strong hands may push the market anywhere from here,
Note
Today close will be important.It may surprise, we'll see.
Note
In the meantime having lost 7900-8000$support area price quickly dopped into the 7700$ range for a further SMA100/W test. It was well expected as a consequence of such a breakout.We are now evaluating the strength of this support, which was tested already 2 times.
Note
A last important hint for today.Look at what's going on:
That yellow box seems to be a half staff and that's generally pretty bad in TA.
BUT you should doublecheck today close, because IF bulls show up here and manage to push price up a couple hundred dollars we may end up with a diamond bottom ( with an outlier ).
So let bears roar, but keep your eyes open.
Note
Yes, keep your eyes wide open.As you see surprise came, just a day late.
***IF*** the bulls manage to keep current levels on daily close they may achieve some impressive bear trap.
Below a 2D chart, to better show what i mean.
Pretty volatile days, let's see daily volume and close.
Note
For bulls it is critical to close today on high volume.Note
Insufficient volume, boring range bond price action.*Short term*
Hopefully bulls will nail this flag and look for a close over 8300$.
Note
Called it.Nice flag breakout as you see.
Let's see daily close.
Note
Currente scenario, zooming out a bit:Note
Here we are, at resistance.This was the easy part.
Now a good daily close in needed.
Note
A decent close would mean margin for attacking 9000$ +, probably after some good consolidation.
Note
Rejected again by MA200/D.Come on bulls .. you can't fail this breakout.
Note
Support should not be lost or bears will probably take over.Note
Still under MA100/D, still weak volume.Bulls should hurry up, better not challenging support again here.
For them is imperative to break through soon, as you may see shorter term MAs are already rolling over.
Note
Bulls did'nt show up so far.Now price is in a congestion phase ( see red box ), a tad higher than middle of BB ( meaning very short term is neutral and not trending ). Bollinger bands shrinking, with overall low volatility and volume.
All this means we're about to see a ***BIG*** move.
It's hard to forecast the direction as for now market shows no momentum.
So watch out closely for a Bollinger Bands breakout on volume on Daily TF.
In case of a break-up, further watch MA200/D as it rejected all attacks so far and that's by far the most meaningful resistance here.
Note
2 simple reasons bulls may have a small edge here:They broke up medium term RSI wedge:
They're somewhat close to do the same on MACD:
Obviusly that's not enough, so keep an eye on further price action.
Note
Testing support.Soon we'll see the outcome.
Note
Here we are, look at weekly RSI.Bottom of channel and decision point.
Form here either epic bear trap or crumble.
Note
To be fair short term it looks so obviously bad and ugly i think i'm opening a counter-trend Long. A small loss for a potentially good opportunity, desspite of probabilities ;)
Note
Weekly OBV at long term support as well.Make it or break it, Bitcoin.
Disclaimer
The information and publications are not meant to be, and do not constitute, financial, investment, trading, or other types of advice or recommendations supplied or endorsed by TradingView. Read more in the Terms of Use.
Disclaimer
The information and publications are not meant to be, and do not constitute, financial, investment, trading, or other types of advice or recommendations supplied or endorsed by TradingView. Read more in the Terms of Use.