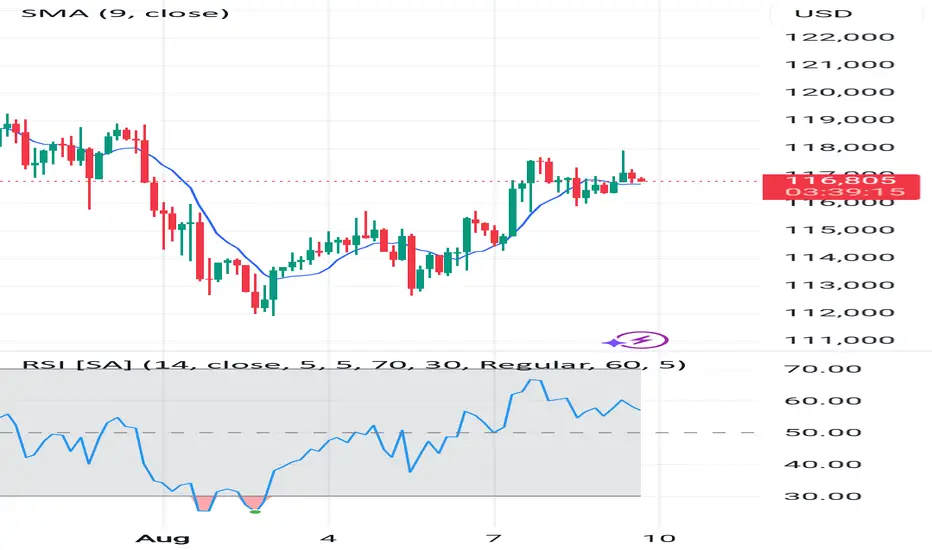
Bitcoin (BTC) is currently trading around $116,877, showing signs of recovery after a recent pullback. On the 4-hour chart, price action is holding above the 9-period Simple Moving Average (SMA), suggesting short-term bullish momentum.
Price Action & Trend
Over the past few sessions, BTC has formed a higher low pattern, indicating buying interest at lower levels. The recent breakout above $116,000 signals renewed bullish sentiment, but the price is facing resistance near $118,000–$119,000. A decisive close above this zone could open the door for a rally toward $121,000–$122,000.
RSI Analysis
The Relative Strength Index (RSI) is currently around 60, staying in bullish territory but not yet in the overbought zone. This suggests there is still room for further upside before any major correction pressure sets in.
Key Levels to Watch
Resistance: $118,000 – $119,000, then $121,000 – $122,000
Support: $116,000, followed by $114,500 and $113,000
Outlook
The short-term trend remains positive as long as BTC holds above $116,000. However, failure to break the $118,000–$119,000 resistance area could trigger a short-term pullback toward $114,500. Traders should watch for a confirmed breakout for potential continuation plays.
Disclaimer
The information and publications are not meant to be, and do not constitute, financial, investment, trading, or other types of advice or recommendations supplied or endorsed by TradingView. Read more in the Terms of Use.
Disclaimer
The information and publications are not meant to be, and do not constitute, financial, investment, trading, or other types of advice or recommendations supplied or endorsed by TradingView. Read more in the Terms of Use.