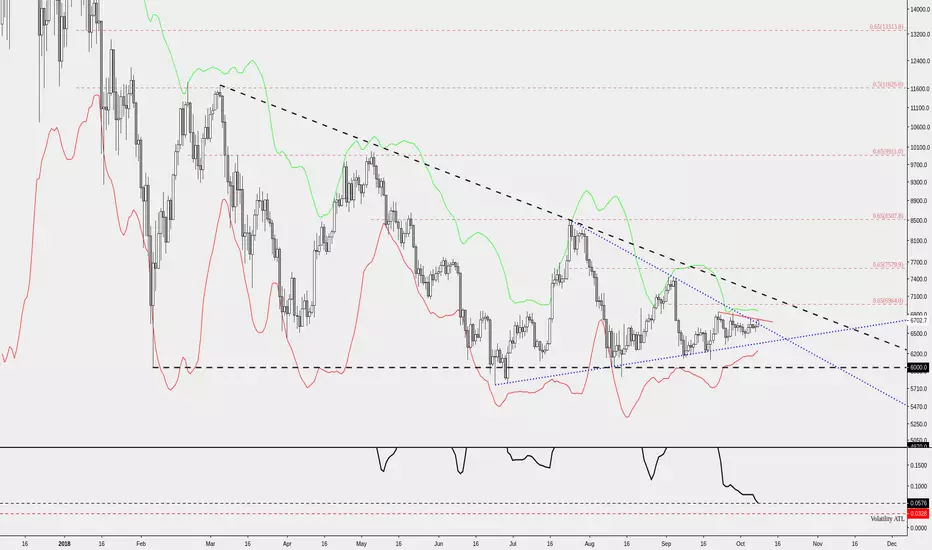
So, BTC is testing the resistance of the blue symmetric triangle and maybe we will see a breakout that is strong enough to push the price through the upper band of the BB with source set on high. Volatility is near ATL and a push through the upper band on the daily chart is what the bulls want to see because it could be the start of a small bull run that will retest some of the 0.65s that sent us down every time we touched them. The break of the 0.65s is very important, we highlighted this in our last update.
Note
We are very close to invalidating that hidden bullish DIV. Great RR for a LONG here. We are retesting the blue triangle.Note
Trying to see things from a different perspective. The chart is VERY bullish but the probability of an ascending triangle to break down is not that low to be ignored. Combining the breakout from the triangle (up/down) with the extreme squeeze on the high timeframes (daily, 3d, weekly) we expect to have a trend that will last for at least one month.
Related publications
Disclaimer
The information and publications are not meant to be, and do not constitute, financial, investment, trading, or other types of advice or recommendations supplied or endorsed by TradingView. Read more in the Terms of Use.
Related publications
Disclaimer
The information and publications are not meant to be, and do not constitute, financial, investment, trading, or other types of advice or recommendations supplied or endorsed by TradingView. Read more in the Terms of Use.
