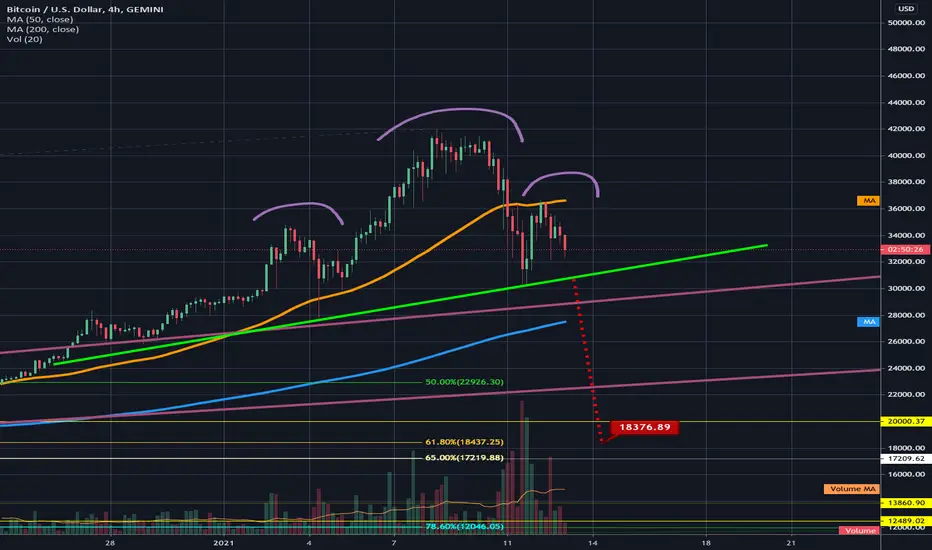
As always we must wait for confirmation of this pattern before attempting to trade it. There is compelling bearish confluence here with the breakdown target from this pattern lining up perfectly with the .618 golden fib retracement. Not only this, but this zone is also just below where the extremely strong support from the weekly 21 ema (not shown here) is located. As we have seen in the previous bull market of 2015-2017, the weekly 21 ema was able to maintain support for price action throughout the entire bull market and was retested every correction except one during that bull market. These 3 things combined increases the probability of a breakdown to this zibe significantly where we could see a wick all the way down to the golden fib fulfilling the H&s breakdown target while the body of the candle still manages to close above that with the weekly 21 ema maintaining support. Of course, it's also possible the correction could be over well before that with such parabolic bullish fever still very much in the air....the coming FUD concerning the 14 trillion tether lawsuit as well as the recent executive order passed against chinese companies also suggests a deeper correction is likely...but ultimately we must still wait to see if this h&s breakdown confirms first. I will be watching to see if this top ascending plum colored trendline from the previous ascending broadening wedge we were in can maintain its support. I will not be convinced the h&s breakdown will occur until it is clear that this trendline has been flipped to solidified resistance. This is as always only my personal strategy and not financial advice nor am I a financial advisor. Best of luck in whatever trade you decide to take and thanks for reading!
Note
price action has finally broken below the h&s neckline it is having a rebound currently but is still under the neckline...if the neckline maintains resistance the breakdown target is now around 22kNote
now that the breakdown target of the h&s has reached 22k....I find it is important to mention that the weekly time frames 21 exponential moving average is right now currently right at the 22k level too which makes for some very compelling bearish confluence..I think that highly increases the likelihood of this h&s pattern breaking down and price action falling to 22k to finally test the 21 weekly ema's support. the 21 weekly ema got tested as strong support multiple times last bull run and odds are good it will continue to do the same this time...I anticipate that the 21 weekly ema will ultimately hold support and the bull run will continue after testing it.Disclaimer
The information and publications are not meant to be, and do not constitute, financial, investment, trading, or other types of advice or recommendations supplied or endorsed by TradingView. Read more in the Terms of Use.
Disclaimer
The information and publications are not meant to be, and do not constitute, financial, investment, trading, or other types of advice or recommendations supplied or endorsed by TradingView. Read more in the Terms of Use.
