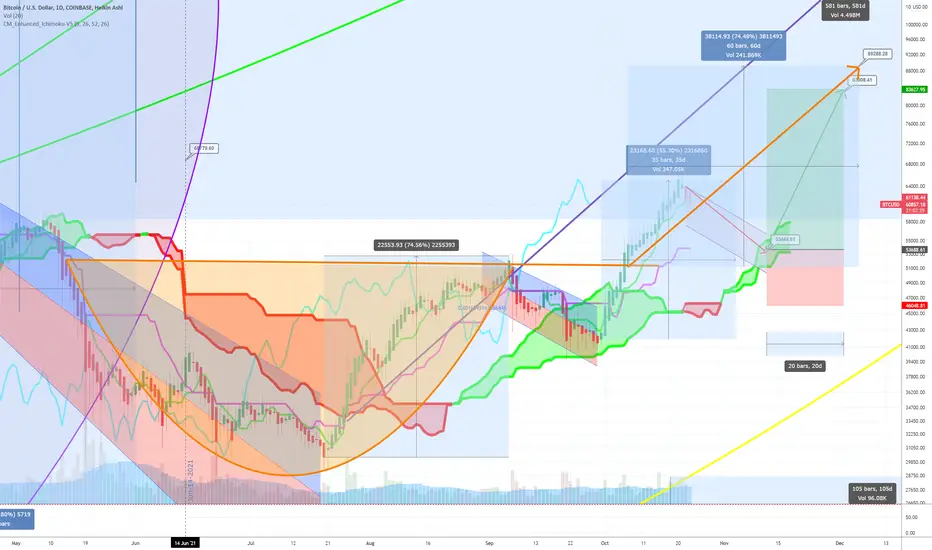
I'm not convinced this is a great Cup and Handle formation, but it is there and it is also on ETH.
However, if you compare it to the other charts, the numbers seem to be within the same reasonable ballpark and timeframe, so it's possible that multiple patterns will more strongly confirm the target.
I also don't remember how to calculate the estimated date for a C&H target to complete, so I just used 60 days as an estimate.
Lets see how this one does after the test of time.
Trade active
If you hit play a few times, you'll see the green line appear. I believe that was the older trend line from prior years. I'll have to go look closer at this chart, but it appears we're right up against the bottom of this green line meaning, if we break the multi-year trend, we'll likely get a good morning rise.Related publications
Disclaimer
The information and publications are not meant to be, and do not constitute, financial, investment, trading, or other types of advice or recommendations supplied or endorsed by TradingView. Read more in the Terms of Use.
Related publications
Disclaimer
The information and publications are not meant to be, and do not constitute, financial, investment, trading, or other types of advice or recommendations supplied or endorsed by TradingView. Read more in the Terms of Use.