Yesterday’s analysis/position: Was strongly expected a quick drop to $6,800 to follow a breakdown of $7,275.
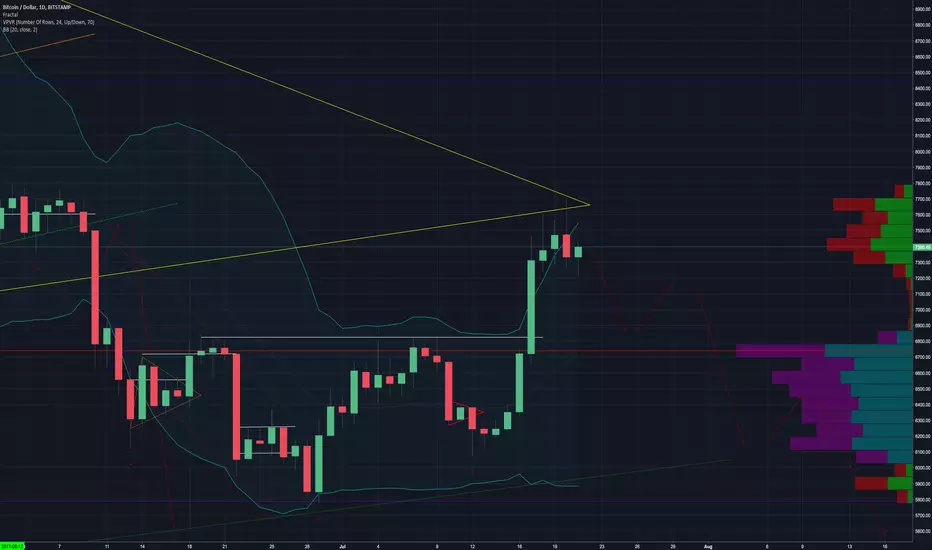
Patterns: Retesting triangle
Horizontal support and resistance: S: $7,275 R: $7,500
BTCUSDSHORTS: Found support at 20,000 but yet to increase significantly. Lowest they have been since May.
Funding Rates: longs pay 0.01% to shorts
12 & 26 EMA’s (calculate % difference): 12: +6.23% 26: +9.03% bullish cross on daily. Making bullish cross on 1h right now.
50 & 128 MA’s: 50: +10.08% 128: -2.69% Just broke through 50 ma on the 1h.
FIB’s: 0.382 = $8,448 0.236 = $5,789
Candlestick analysis: Currently forming a hanging man on daily. 3d shooting star.
Ichimoku Cloud: Tenkan and Kijun angling down and not longer look like they will make a bullish crossover. Top of cloud still serving as strong resistance. Completed edge to edge on 12h yesterday, wicked off the top of the cloud. Bearish TK' cross on 1h, and reentered cloud. C clamp on 4h and Tenkan serving as resistance. Bearish TK' cross on 30m, bearish cloud. Tenkan has been acting as support.
TD’ Sequential: Green 1 on weekly. Green 2 on 3d. Green 6 on daily. Red 3 on 12h.
Visible Range: 1y: Resistance stacked to $8,500. Gap at $4,500 that is begging to get filled. 1w: Heavy resistance from $7,375 - $7,500 very little support until $6,800 1d: A little support at $7,275 - $7,300.
BTC Price Spreadsheet: 12h: +1.55% 1d: +0.55% 1w: +15.47% 2w: +10.32% 1m: +9.49%
Bollinger Bands: First time we have had 2 daily candles close outside of the top band since 9/1/17 when the price proceeded to correct -38.46% in 13 days. MA on weekly band is apart of the resistance cluster. Still above MA on monthly.
Trendline: Connect 9/15/17 to 6/28/18 (green dotted). That bull trend is apart of the support cluster at $5,800 with the 0.236 FIB.
Daily Trend: 17 hour bull trend
Fractals: UP: $7,750 DOWN: $6,069
On Balance Volume: bear div' on monthly
Chaikin Money Flow: Turned prior resistance into support at 0.05. Will it make a new high above 0.15 for the first time since April?
Buy/Sell Sentiment on Trading View: Oscillators: Neutral MA’s: Buy Summary: Buy (counter trade) RSI: 65.1 (should pull back) Will it cross 50 on weekly? Stoch: 84.4 (just had a sell signal on daily)
Conclusion: When $7,274 was violated I expected the selling volume to come hard and fast. Instead quickly rebounded and that is a serious cause for concern. 1 hour chart has a higher low and higher high. If we break through $7,500 before creating a new low below $7,284 then I will seriously consider closing my position.
The cloud has been acting as strong resistance on the daily and the 12h. The VRVP shows strong resistance at current price levels. The Bollinger Band strongly indicates that a correction is coming. The RSI is at overbought levels and the Stoch just had a sell signal.
Will continue to hold onto my shorts with a stop at $7,826. However my confidence in the position is waning and I will be watching closely for reasons to exit at/around breakeven.
Note
OBV divergence in lower timeframe indicates that the whales have been selling this bounce.emasar Indicator is available for purchase at alphanalysis.io/product/emasar/
Disclaimer
The information and publications are not meant to be, and do not constitute, financial, investment, trading, or other types of advice or recommendations supplied or endorsed by TradingView. Read more in the Terms of Use.
emasar Indicator is available for purchase at alphanalysis.io/product/emasar/
Disclaimer
The information and publications are not meant to be, and do not constitute, financial, investment, trading, or other types of advice or recommendations supplied or endorsed by TradingView. Read more in the Terms of Use.