Hello Traders !
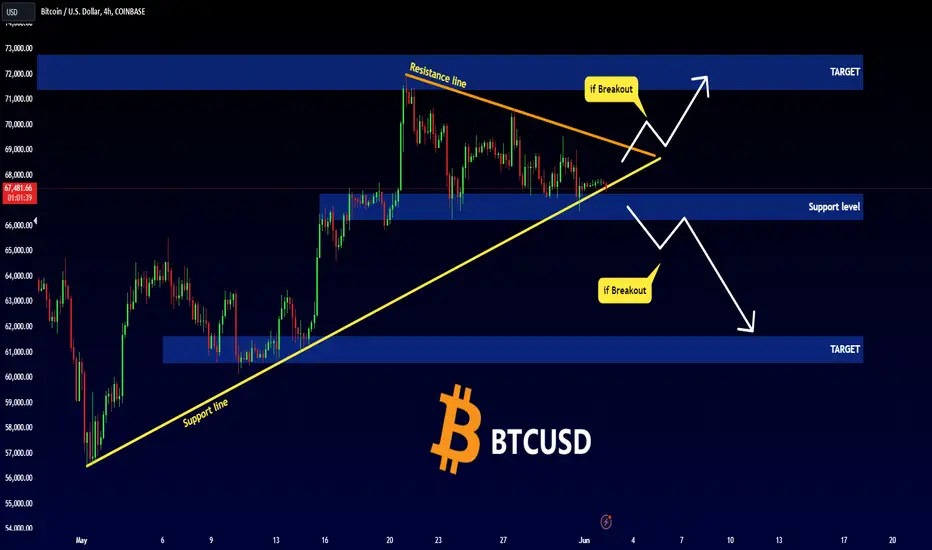
The Bitcoin price formed a descending triangle pattern.
We have 2 scenarios:
BEARISH SCENARIO:
if the price breaks and closes below the support level (67276 - 66259),
We will see a huge bearish move📉
TARGET: 61640🎯
BULLISH SCENARIO:
if the market breaks above the resistance line and closes above that,
We will see a bullish move📈
TARGET: 71400🎯
Trade closed: target reached
🔴I Didn't Enter into a Buy Trade !🎉Congrats for Buyers !
🟩Telegram Channel: t.me/+6G3utzu-7L03NmZk
Related publications
Disclaimer
The information and publications are not meant to be, and do not constitute, financial, investment, trading, or other types of advice or recommendations supplied or endorsed by TradingView. Read more in the Terms of Use.
🟩Telegram Channel: t.me/+6G3utzu-7L03NmZk
Related publications
Disclaimer
The information and publications are not meant to be, and do not constitute, financial, investment, trading, or other types of advice or recommendations supplied or endorsed by TradingView. Read more in the Terms of Use.